Purpose:
In LoadRunner, the Average Response Time Graph is used to plot the graph for the response time of each transaction during the performance test. Now, here is a question What is response time, so “Transaction Response time” refers to the time that elapses between when a user does an action on the web page like press the ‘Order’ button till he gets the order number from the server. In simple words the time between when the first byte (of request) is sent to the server till the last byte (of response) is received from the server. This response time also includes network delay time. To get more information about response time, refer to the article “What does come under a simple”Response Time”?”.
Graph Axes Representation:
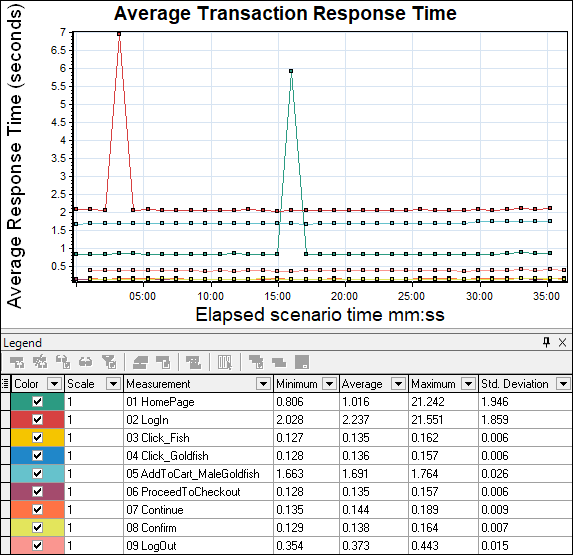
- X-axis: This graph has elapsed time on the X-axis. The elapsed time may be relative time or actual time as per the graph’s setting. This also shows the complete duration of your test without applying any filter.
- Y-axis: It shows the average transaction response time (in seconds)

How to read the Average Transaction Response Time Graph?
You can see multi-colour lines in the response time graph. These lines show the response time of each individual transaction along the time. Peaks in the graph indicate a delay in getting the response. This delay may be due to user load, server fault or network issue which need to be investigated by referring to Latency, Error per second, Throughput or Running Vusers Graph. You can also apply a filter to look into individual transaction performance. A flat line of transaction response time within SLA during steady-state shows the application’s good performance, on the other hand, more fluctuation or deviation means performance may vary under actual load conditions in the live environment.
The bottom table has some columns like line colour, scale, measurement (i.e. name of transactions) minimum, maximum, average, standard deviation etc. The numbers in the table help to validate the defined NFRs for a particular transaction.
Example:
As stated earlier, LoadRunner uses the ‘Average Transaction Response Time’ graph to represent the average time taken to perform transactions during each second of the test. If you run a test with 5 Virtual Users and 1 transaction (say Login) and get the response time:
1st Vuser has 1 sec Transaction Response Time
2nd……………..2 secs…………………………………….
3rd………………3 secs…………………………………….
4th………………4 secs……………………………………..
5th………………5 secs……………………………………..
So, the average transaction response time of the Login transaction would be (1+2+3+4+5)/5=3 secs.
Merging of ‘Average Transaction Response Time Graph’ with other graphs:
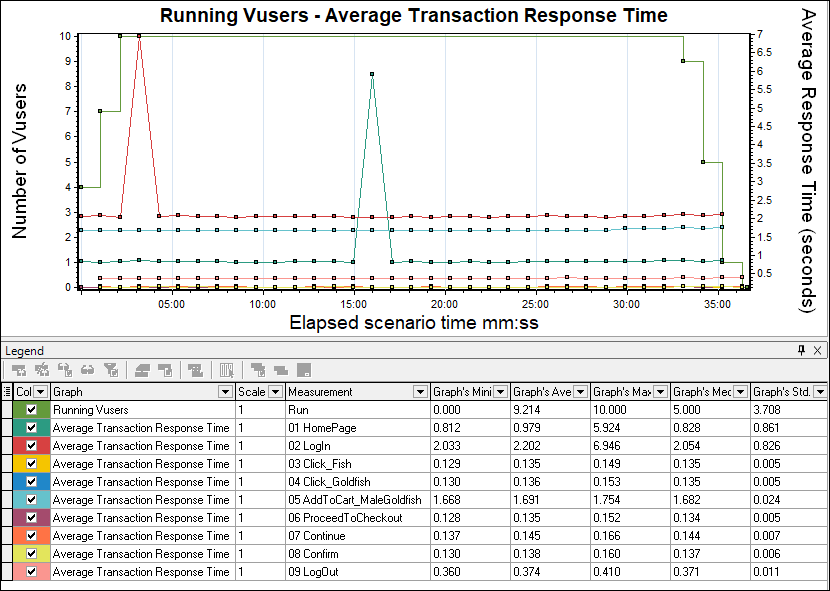
- With Running Vusers Graph: In the LoadRunner Analysis tool, you can correlate the Average Transaction Response Time graph with the Running Vuser graph to see how the number of Running Vusers affects the transaction response time. Normally, the Average Transaction Response Time of the transactions in the graph should have very little deviation. I won’t say the average response time should be constant because that is an ideal condition. In some cases, average response time increases or decreases at the beginning or during the test then merge this graph with the Running Vuser graph to understand the impact of user load on the server response time. Sometimes you can see a sudden drop in the average response time and when you merge with the Running Vuser graph you come to know that some of the Vusers exited at the same time.

- With Throughput graph: The average transaction response time graph can be overlaid with the Throughput graph. You may find different patterns while analysing the throughput graph with the average transaction response time graph which is:
- An Increase in Throughput along with Response time: This situation is possible when users are ramp up.
- An Increase in Throughput when the Response time drops: This situation may occur when the system is recovered and started responding too fast.
- A Constant Throughput with the increase in Response time: The reason may be a network bandwidth issue or request queuing issue. If the network bandwidth is reached at its maximum limit then it causes a delay in transferring the data. Therefore throughput makes a flat line (max bandwidth) and response time makes a top-headed inclination.
- A decrease in Throughput with an increase in Response time: If you see in the graph, throughput decreases with the increase in response time then investigate at the server end.

- With Error Graph: Response time graph when overlaid with error/second graph then you can easily identify the exact time when the first error occurred as well as the time until the error lasts. You can also check whether response time increases after the first error appeared. Commonly, an increase in error % during ramp-up indicates an error due to user load. If an error is identified during steady-state then this indicates queue pile-up at the server (a large number of unprocessed requests at the server end). As I said, before making any conclusion you have to investigate properly by referring to different analysis graphs as well as by merging them together.

The Average Transaction Response Time graph is an important graph that can be directly compared with the defined NFRs; provided that proper response time NFRs are available. So, definitely use this graph while analysing the test results.
You may be interested:
- Performance Testing Tutorial
- Performance Engineering Tutorial
- Apache JMeter Tutorial
- Neotys NeoLoad Tutorial

