In the last article i.e. LoadRunner – Average Transaction Response Time, you got detailed information about the transaction response time graph and how to merge it with other important graphs. Apart from the average transaction response time graph, there are some more graphs which are related to response time and shows the result in a different view. Let’s have a look at what are those graphs:
Transaction Performance Summary Graph:
LoadRunner provides a ‘Transaction Performance Summary’ graph to display the minimum, maximum and average performance time for all the transactions during the test.
Axes representation:
- X-axis: The unit on this axis represents the name of the transactions.
- Y-axis: It shows transaction response time (in seconds).

Transaction Response Time (Distribution) Graph:
LoadRunner provides a ‘Transaction Response Time (Distribution)’ graph to display the distribution of the time taken to perform transactions during the test. using this graph you can identify the high response time transactions. Example: Refer to Figure 02, you can get 06_ProceedToCheckout has the highest response time among all the transactions.
Axes representation:
- X-axis: It shows transaction response time (in seconds)
- Y-axis: It shows the number of transactions executed during the scenario

Transaction Response Time (Percentile) Graph:
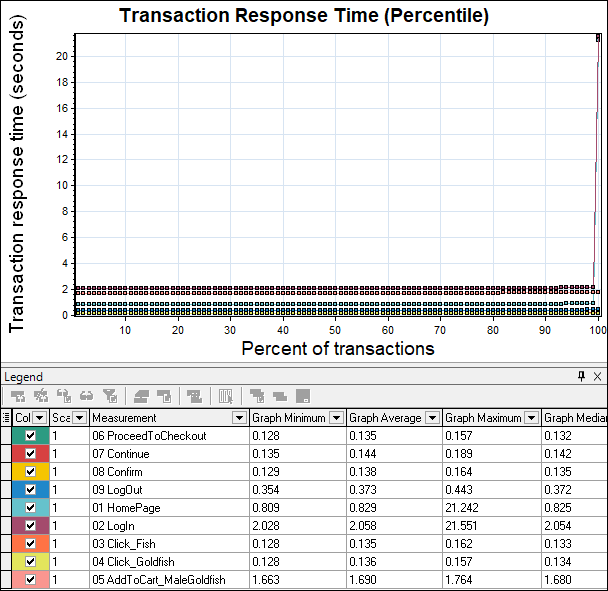
LoadRunner provides a ‘Transaction Response Time (Percentile)’ graph to determine the percentage of transactions that met the performance criteria defined for your system. In many instances, you need to determine the percentage of transactions with an acceptable response time. The maximum response time may be exceptionally long, but if most transactions have acceptable response times, the overall system is suitable for your needs.
Refer to the below figure, 01_HomePage and 02_LogIn transactions have approx. 98% of transactions are below 3 seconds and the rest 2% of transactions have a more than 20 seconds response time. If your SLA allows then you can ignore 2% of the transaction.
Axes representation:
- X-axis: It shows the percentage of the total number of transactions measured during the load test
- Y-axis: It shows transaction response time (in seconds) round-off value

Transaction Response Time (Under Load) Graph:
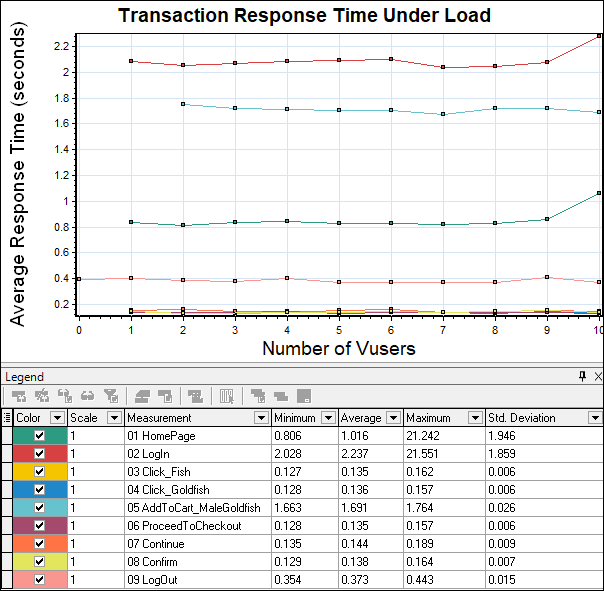
LoadRunner provides a ‘Transaction Response Time (Under Load)’ graph to determine the impact of user load on response time. If the graph follows an upward trend then you can say after increasing the number of users gradually the response time is also increasing. A single line with colour dotted shows no impact on response time due to user load.
Axes representation:
- X-axis: It shows the number of Vusers
- Y-axis: It shows the average response time (in seconds)

Transaction Summary Graph:
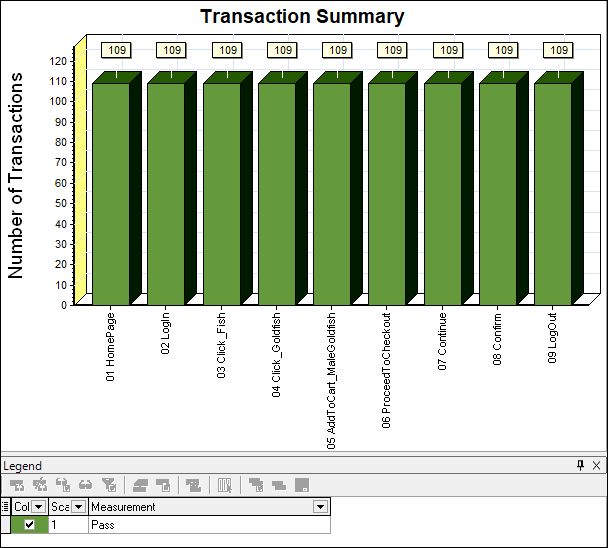
LoadRunner has a ‘Transaction Summary’ graph to show failed, passed, stopped, and ended in error transactions. You can get the same count from the summary report as well. Figure 05 shows that all the transactions are passed. Hence you can see green buildings of transactions.
Axes representation:
- X-axis: It shows the name of transactions
- Y-axis: It shows the number of transactions

These graphs are optional but provide detailed information about transactions, transaction count, transaction status and response time. Therefore it is good to study them while analyzing the test result. You can also include some of these graphs in the test report so that the client can easily understand the behaviour of the application under load.
You may be interested:
- Performance Testing Tutorial
- Performance Engineering Tutorial
- Apache JMeter Tutorial
- Neotys NeoLoad Tutorial

