
Many times, we develop Unit Test Scripts to check the code stability prior to the actual load test. These are the small test scenarios which run in the GUI mode with a small load like 1 to 5 threads. So, we come up with the need to generate the HTML Dashboard Report from GUI mode instead of Non-GUI mode just to save some the time using JMeter.
There are two methods to generate JMeter HTML Dashboard Report in GUI mode which are:
- Using “Simple Data Writer”
- Using “BeanShell Sampler”
Method 1: Using “Simple Data Writer”
Step 1: Goto to the “bin” folder of JMeter and open the “user.properties” file using Notepad or Notepad++. Then go to the section “Reporting configuration” in the file. Make the changes as mentioned below:
Modified Values:
jmeter.reportgenerator.overall_granularity=1000
jmeter.reportgenerator.apdex_satisfied_threshold=500
jmeter.reportgenerator.apdex_tolerated_threshold=1500
jmeter.reportgenerator.exporter.html.series_filter=^(01_Launch_HomePage|02_Select_Any_Animal|03_Select_A_Type|04_Select_A_Sub_Type|05_Clicking_AddToCart|Dashboard_Report_Generation)(-success|-failure)?$

Explanation of the changes:
Refer the link
Step 2: Save the user.properties file and relaunch the JMeter to apply the changes.
Step 3: Add a “Simple Data Writer” in your Test Plan at Thread Group Level.

Step 4: Give a file name with the proper path and extension “.csv”.

Remember: You do not need to create any such file by yourself, just give a file name and path in this field with “.csv” extension. JMeter will automatically create the file and save data to it.
Step 5: Click the “Configure” button. Select all the Checkboxes in it, except the 1st one, i.e. “Save as XML”. The illustration goes as:

Step 6: Save the “Test Plan” and start the test in GUI mode by clicking the “Run” button.
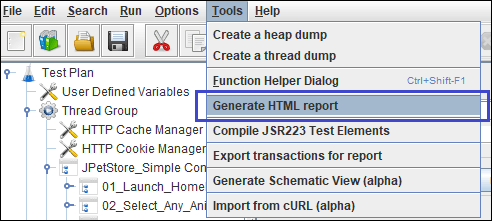
Step 7: After the completion of the test, a “<file name>.csv” file (as shown in Figure 04, JPetStore_Result.csv) is created at the given file path in “Simple Data Writer”. Now, you need to click on “Tools” and select “Generate HTML report”.
Step 8: A window pops up and asks for 3 inputs.
- Result file (csv or jtl): Browse the <file name>.csv file created in Step 7.
- user.properties file: Browse the user.properties file updated in Step 1.
- Output directory: Third input is for the Output Folder/Directory where you want to save the generated HTML Report.

Step 9: You need to carefully pass all these 3 inputs then click on the “Generate report” button. This will generate the report in the Output Folder/Directory path that you have provided and you will receive a “Report created!” message.

Step 10: Open the “index.html” file inside the Output Folder using Google Chrome (as Google Chrome supports the best) and navigate through different graphs present on the left side of the Report.

Method 2: Using “BeanShell Sampler”
Step 1 to Step 5: Same as Method 1.
Step 6: Add a ”tearDown Thread Group” in the test plan.

Step 7: Add a “BeanShell Sampler” under “tearDown Thread Group”
Step 8: Write the below code in the BeanShell Sampler (Only for Windows Users)
Runtime.getRuntime().exec(
"C:/Windows/System32/cmd.exe /c jmeter -g <path with file name>.csv -o <path with empty folder name>");
Remember: .csv result file is the same file whose path you have given in “Simple Data Writer” in Step 4 and the folder name is where you want to store the generated HTML Report.
The illustration goes as:

Step 9: Save the Test Plan and Run the test in GUI Mode. After the test is finished, you will get the HTML Report generated automatically by JMeter in the Result Folder/Directory that you have given. Open “index.html” to read the report.
You may be interested:
There is any way to generate report from JTL generated with simple data writer marked with “Save as XML”?
You can try with
jmeter -g “JTL file with path” -o “path of blank folder”
Is it possible to share this report to others via mail
Thank you, very usefull information
I have JMeter 5.0 it do not have “tools ” Tab, what should i do?
Bad luck.
Comments are closed.