
In general, the “Request Summary” of JMeter HTML Report has a Pie Chart with “OK” and “KO” legends. These two legends show the pass and fail percentage of the total request executed during the test.
OK stands for Success and KO stands for Failure
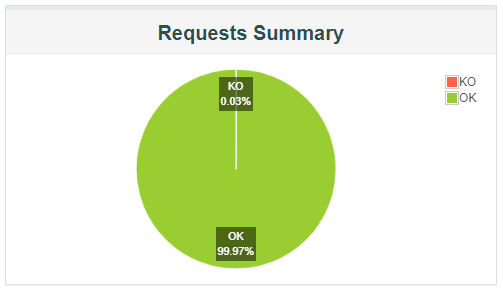
But, there is no such valid meaning of KO here. And this makes many clients confused when they read the test report. So, it is better to represent OK and KO by some meaningful names like Pass or Fail, Success or Failure etc.
Steps to Customise Request Summary Legends:
Step 1: Go to bin -> report-template -> content -> js folder inside the JMeter directory.
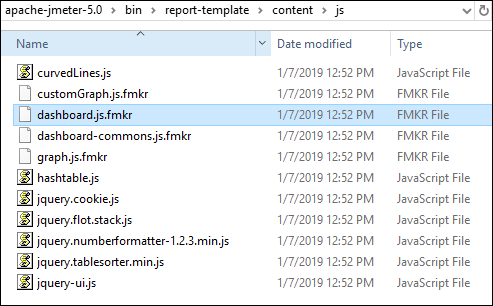
Step 2: Open file “dashboard.js.fmkr” using Notepadd++. An illustration is shown below:
Step 3: Search for the lines “label” : “KO”, and “label” : “OK”, as illustrated below:

Step 4: Change KO and OK in the above lines to Fall and Pass or any appropriate value.

Note: Only do the changes in these two words. If you change any other things, you may land in some problems.
Step 5: Save the file and restart the JMeter.
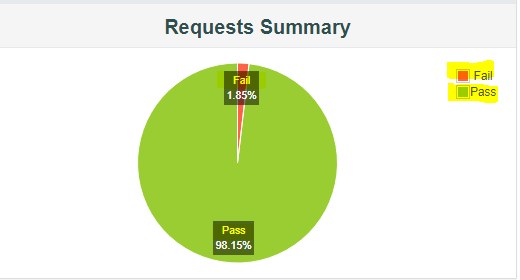
Step 6: Run the test and open the report. You will get the Request Summary Pie Chart below:
You may be interested: