
JMeter is an open-source performance testing tool, but in today’s world, it is competing with paid licensed tools with its improved features. One of the main drawbacks of the old version of JMeter was reporting and test result analysis. There were very few listeners available which took time to carry out a proper analysis. After completing the analysis, the performance tester had to create a manual test report which was again a time-consuming task.
JMeter 3.0 onwards, you can find a new reporting feature in JMeter called Dashboard Report. This is an HTML report which has a summary dashboard including all the basic graphs. JMeter Dashboard Report solves the reporting problem in JMeter. Now, let’s have a look at how you can generate a correct JMeter HTML Dashboard report.
Pre-requisites:
While creating a Test Script for a Test Scenario in JMeter, the best practice is to keep the group of samplers belonging to a particular user action inside a Transaction Controller. By default, when you record a JMeter script there is an option to wrap the related samplers into a Transaction Controller. Once the recording is completed then perform the “Apply Naming Policy” action to all the samplers inside each Transaction Controller. Without proper naming of the samplers, you may face challenges to read JMeter HTML Dashboard Report.
Some Important Points before proceeding:
- It is mandatory as well as recommended to uncheck the below options of all the Transaction Controllers.
- Generate parent sampler
- Include the duration of the timer and pre-post processors in generated sample
By default they are unchecked.
- It is mandatory as well as recommended to perform the “Apply Naming Policy” action for each group of samplers inside the respective Transaction Controllers. This can be done by “right-clicking” on each Transaction Controller.
- Always, remember to restart JMeter on modifying any of the .properties, .bat or .lib file or adding a new plug-in in JMeter folder.
- Disable the unwanted elements of the script like the debug sampler, listeners etc. before running a test in GUI or Non-GUI mode.
- Use “Backslash” (i.e. “/ “) while giving File path or Directory path. JMeter recognises the forward-slash (i.e. ” \ “) as Escape Character.

Remember:
1. If you select the option “Generate parent sample” in Transaction Controller and run the test in Non-GUI mode then you will not see the Test Summary. Test will execute, but Test Summary will not generate.
2. Furthermore, the CSV (or JTL) file will be having some missing information on some samplers and some Graphs/Tables will be empty or will not have enough details in the HTML Report, examples:
a. Top Errors
b. Top Errors by Samplers
c. Response code over time
JMeter v5.1.1 onwards, there are no such pre-defined changes that need to be applied or remembered for HTML Report generation. If you have JMeter older than v5.1.1 then follow the pre-requisite mention in this post (Link).
This post shows the generation of the Dashboard Report through JMeter v5.1.1 and JPetStore.jmx. The illustration goes as:
Generation of Dashboard Report in Non-GUI mode
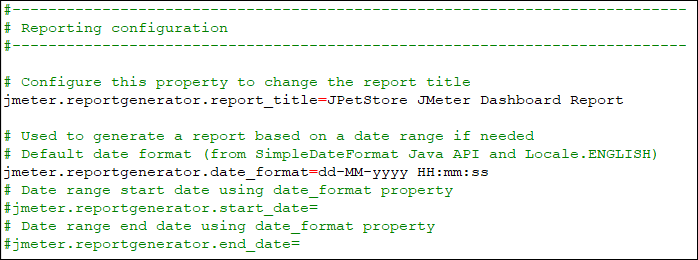
Step 1: Goto to the “bin” folder of JMeter and open the “user.properties” file using Notepad or Notepad++. Then go to the section “Reporting configuration” in the file. Make the changes as mentioned below:
Default values were:
#jmeter.reportgenerator.overall_granularity=60000
#jmeter.reportgenerator.apdex_satisfied_threshold=500
#jmeter.reportgenerator.apdex_tolerated_threshold=1500
#jmeter.reportgenerator.exporter.html.series_filter=^(Search|Order)(-success|-failure)?$
Modified values are:
jmeter.reportgenerator.overall_granularity=1000
jmeter.reportgenerator.apdex_satisfied_threshold=500
jmeter.reportgenerator.apdex_tolerated_threshold=1500
jmeter.reportgenerator.exporter.html.series_filter=^(01_Launch_HomePage|02_Select_Any_Animal|03_Select_A_Type|04_Select_A_Sub_Type|05_Clicking_AddToCart|Dashboard_Report_Generation)(-success|-failure)?$

Note: Apart from the above-suggested changes all other settings will be the same.
Explanation of the changes:
- The property “jmeter.reportgenerator.overall_granularity” shows the granularity of the graph. This value should never be less than 1 Sec (or 1000 ms). For a short-duration test, it is good to keep a minimum granularity value i.e. 1000 (denotes 1000 ms or 1 Sec), so that graphs and errors are visible correctly. In case, if you run an endurance test which has a longer duration then you may keep it 60000. The default value of this property is 60000 (i.e. 1 minute).
- “jmeter.reportgenerator.apdex_satisfied_threshold” represents the response time NFR which is applicable to all the samplers. The response time above the satisfied threshold value is considered as NFR breached.
- “jmeter.reportgenerator.apdex_tolerated_threshold” represents the bearable maximum response time. Ideally, both satisfied and tolerated threshold values should come from the client or be taken as a benchmark value before conducting the test.
Example: A client has provided 3 seconds as response time NFR and 5 seconds as the maximum response time NFR, so 3 seconds becomes the satisfied threshold value and 5 seconds become tolerated threshold value. - On the basis of the satisfied and tolerated threshold APDEX (Application Performance Index) is calculated.
- The property “jmeter.reportgenerator.exporter.html.series_filter” represents the name of transactions which you want to show in the Dashboard Report. Here, you have to give the name of all the Transactions Controllers under your Test Plan. The easiest way to get the Transaction Controller names from Test Plan is JMeter Menu -> Tools -> Export transactions for report.
Now, copy the whole lines and replace the value of - “jmeter.reportgenerator.exporter.html.series_filter” property in the file. In addition, if you do not want to include some of the Transaction Controllers in the report then remove them from the line. The illustration goes as:

Optional changes:
In addition, you can modify a few more properties of “user.properties” file under “Reporting configuration” as per your requirement but they are optional:
To show an appropriate name of JMeter HTML Dashboard Report, update the value of the below property:
jmeter.reportgenerator.report_title=JPetStore JMeter Dashboard Report
To change the time format of “Start Time” and “End Time” in Report update the value of the below property:
jmeter.save.saveservice.timestamp_format= dd-MM-yyyy HH:mm:ss
Step 2: Save the “user.properties” file
Step 3: Set the number of threads, loop count and test duration. Execute the test in Non-GUI mode using the below command:
To run the test in Unix/Linux box. Use the below command:
./jmeter.sh -n -t "<test JMX file>" -l "<test log file>" -e -o "<Path to output folder>"Example: ./jmeter.sh -n -t “JPetStore.jmx” -l “JPetStoreLog.csv” -e -o “/home/JPetStoreProject/JPetStoreResult”
To run the test in the Windows box. Use the below command:
jmeter -n -t <test JMX file> -l <test log file> -e -o <Path to output folder>Example: jmeter -n -t JPetStore.jmx -l JPetStoreLog.csv -e -o C:\JPetStoreProject\JPetStoreResult
The HTML Dashboard report generates in the provided folder. As per the above example, “JPetStoreResult” folder will have the generated Dashboard Report.
Step 4: Open the “index.html” file inside JPetStoreResult folder using Google Chrome (as Google Chrome supports the best) and navigate through different graphs present on the left side of the Report. You will get all the test stats and graphs in the correct format.

You may be interested:
How add no users and duration in html report?
Hi Siva,
You can find the number of active users in ‘Active Threads over the time’ graph and test duration appears on the main dashboard of HTML Report
Can we run this without using command prompt “jmeter -n -t -l -e -o “, If yes, how?
Yes, for that purpose you would require a log file and explicitly by running the command jmeter -g -o you can generate the HTML report.
Hi Aditya,
You can customize the dashboard report by changing the Reporting Configuration in user.properties file.
Why don’t we see total number of users (Total Threads) column in HTML Report as well as CSV file. Can someone let us know how to make it show in report?
Thanks
How can I get “Test Plan” title on HTML Report dynamically so that we don’t have to change manually? Is there any way in report generator to read Test Plan Name and put on HTML Report dyanically?
Thanks
Dear All.
I am facing below issue while generating the html report and its frustrating
Version: 5.4.1
Generating report An error occurred: Error while processing samples: Consumer failed with message :Consumer failed with message :Consumer failed with message :Consumer failed with message :Begin size 0 is not equal to fixed size 5
Please help!
Comments are closed.