
By default, JMeter HTML Dashboard Report represents the time in milliseconds. For a web service test report, it is good to show the response time in milliseconds because their response time is less. Apart from this a web application usually has a response time greater than one second, so to represent the figures in thousand (i.e. milliseconds) is visually not correct. Even in daily life, we use ‘Second’ as the smallest unit of time; not milliseconds. Hence it is a good practice to change and represent the response time in JMeter HTML Report in the format of ‘Second’ instead of ‘Millisecond’.
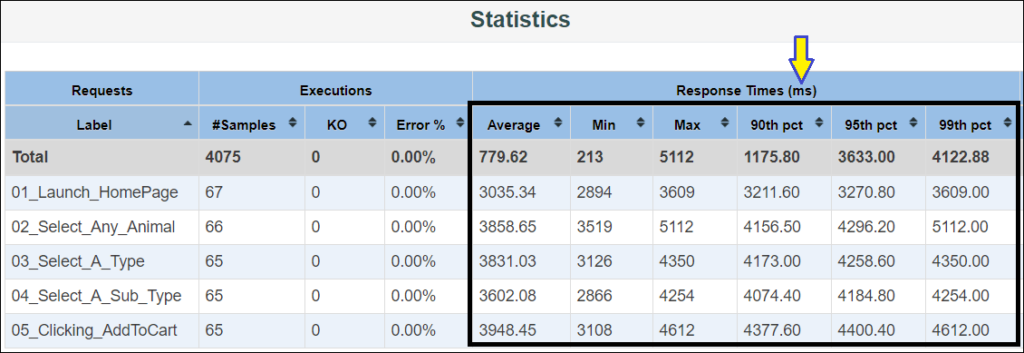
Default JMeter HTML Dashboard Report time format:
Many times it becomes troublesome or extra work to convert these values from milliseconds to seconds and then show them to the Client or Stockholder in the final reporting. Clients and Stakeholders also do not prefer values in milliseconds and they ask for values in seconds for better understanding.
Steps to change the response time value to second in the HTML report:
Step 1: Go to bin -> report-template -> content -> js folder inside the JMeter directory.

Step 2: Open file “dashboard.js.fmkr” using Notepadd++. An illustration is shown below:
Step 3: Search for the lines cell.innerHTML = “Response Times (ms)”; as illustrated below:

Step 4: Change ms to Sec, e.g.:- cell.innerHTML = “Response Times (Sec)”; as illustrated below:

Step 5: Next, Find the line // Create statistics table. There will be some values under the “switch” loop, as illustrated below:

Step 6: Replace the lines from switch(index) to return item; by below lines:
For 5.3 or above JMeter version:
switch(index){
    // Errors pct, 3rd Column
            case 3:
                item = item.toFixed(2) + '%';
                break;
    // Average, 4th Column
            case 4:
		item = (item/1000).toFixed(2);
                break;
	// Min, 5th Column
            case 5:
		item = (item/1000).toFixed(2);
                break;
	// Max, 6th Column
            case 6:
		item = (item/1000).toFixed(2);
                break;
	// Median, 7th Column
            case 7:
		item = (item/1000).toFixed(2);
                break;
    // 90th pct, 8th Column
            case 8:
		item = (item/1000).toFixed(2);
                break;
	// 95th pct, 9th Column
            case 9:
		item = (item/1000).toFixed(2);
               	break;
	// 99th pct, 10th Column
            case 10:
		item = (item/1000).toFixed(2);
		break;
            case 11:
            // Throughput
            case 12:
            // Kbytes/s
            case 13:
            // Sent Kbytes/s
               	item = item.toFixed(2);
                break;
        }
        return item;
For 5.2.1 or below JMeter version:
switch(index){
            // Errors pct, 3rd Column
            case 3:
                item = item.toFixed(2) + '%';
                break;
            // Average, 4th Column
            case 4:
		item = (item/1000).toFixed(2);
                break;
	// Min, 5th Column
            case 5:
		item = (item/1000).toFixed(2);
                break;
	// Max, 6th Column
            case 6:
		item = (item/1000).toFixed(2);
                break;
            // 90th pct, 7th Column
            case 7:
		item = (item/1000).toFixed(2);
                break;
	// 95th pct, 8th Column
            case 8:
		item = (item/1000).toFixed(2);
               	break;
	// 99th pct, 9th Column
            case 9:
		item = (item/1000).toFixed(2);
                break;
            case 10:
            // Throughput
            case 11:
            // Kbytes/s
            case 12:
            // Sent Kbytes/s
               	item = item.toFixed(2);
                break;
        }
        return item;
Explanation of changes:
Each case number represents a column of the Statistics Table in the HTML Report:
Case 3 is for the 3rd Column, i.e. Error%
Case 4 is for the 4th Column, i.e. Average
Case 5 is for the 5th Column, i.e. Min
Case 6 is for the 6th Column, i.e. Max
Case 7 is for the 7th Column, i.e. 90th pct
Case 8 is for the 8th Column, i.e. 95th pct
Case 9 is for the 9th Column, i.e. 99th pct. Case 10, Case 11 and Case 12 are for the last 3 Columns respectively
Step 7: Save the file and restart the JMeter.
Step 8: Run the test and open the report. The values will be coming in Seconds, as illustrated below:

You may be interested:
Thank you very much. It was very helpful. God Bless You.
Comments are closed.