
In the previous post, you have seen how to generate a JMeter Dashboard Report in proper format by doing some simple changes in “user.properties”. Those changes are simple but dedicated to a particular test. If you have another test with a different transaction controller name then again you need to update the “user.properties” file especially the value of ‘jmeter.reportgenerator.exporter.html.series_filter’ line. This could be hectic work when you have a large number of test plans or scripts. Hence there should be a common setting which can generate a JMeter dashboard report without updating the “user.properties” file every time. To solve this challenge, there are two methods:
Method 1:
Create a separate “user.properties” file for each Test Plan/Script and keep them in a folder and pass each as a parameter while doing command-line execution in Non-GUI mode.
Method 2:
Step 1: Goto to the “/bin” folder of JMeter and open the “user.properties” file using Notepad or Notepad++. Then go to the section “Reporting configuration” in the file. Make the changes as mentioned below:
Default values are:
#jmeter.reportgenerator.overall_granularity=60000
#jmeter.reportgenerator.apdex_satisfied_threshold=500
#jmeter.reportgenerator.apdex_tolerated_threshold=1500
#jmeter.reportgenerator.exporter.html.show_controllers_only=false
Modified values are:
jmeter.reportgenerator.overall_granularity=1000
jmeter.reportgenerator.apdex_satisfied_threshold=500
jmeter.reportgenerator.apdex_tolerated_threshold=1500
jmeter.reportgenerator.exporter.html.show_controllers_only=true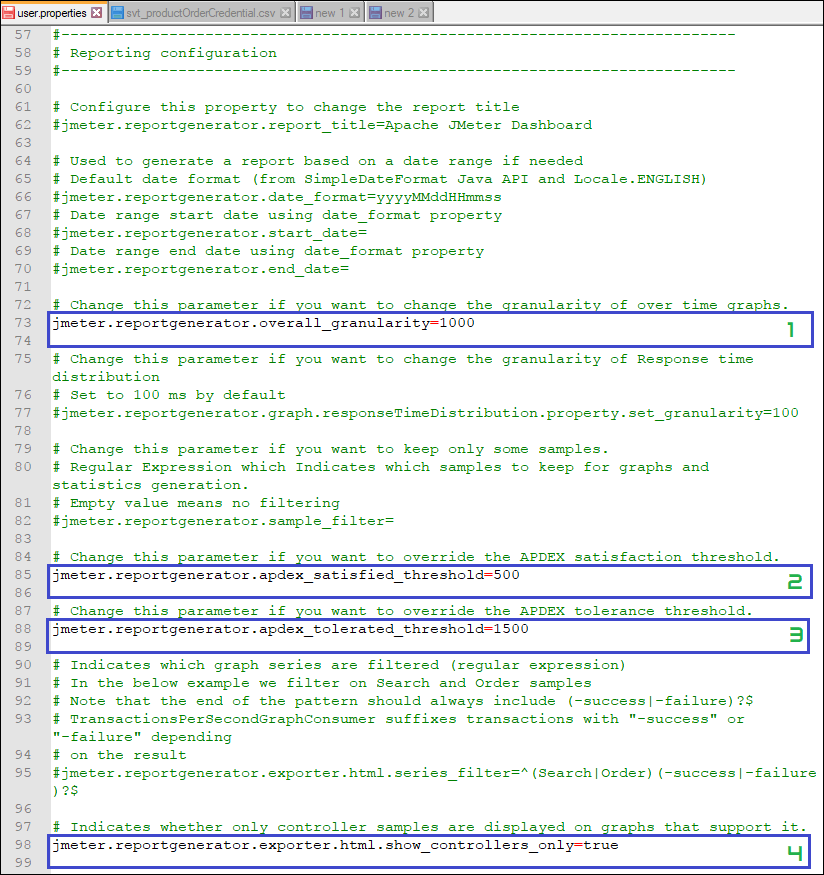
Step 2: Save the “user.properties” file
Step 3: Set the number of threads, loop count and test duration. Execute the test in Non-GUI mode using the below command:
To run the test in Unix/Linux box. Use the below command:
./jmeter.sh -n -t "<test JMX file>" -l "<test log file>" -e -o "<Path to output folder>"Example: ./jmeter.sh -n -t “JPetStore.jmx” -l “JPetStoreLog.csv” -e -o “/home/JPetStoreProject/JPetStoreResult”
To run the test in the Windows box. Use the below command:
jmeter -n -t <test JMX file> -l <test log file> -e -o <Path to output folder>Example: jmeter -n -t JPetStore.jmx -l JPetStoreLog.csv -e -o C:\JPetStoreProject\JPetStoreResult
The HTML Dashboard report generates in the provided folder. As per the above example, the “JPetStoreResult” folder will have the generated Dashboard Report.
Step 4: Open the “index.html” file inside the JPetStoreResult folder using Google Chrome (as Google Chrome supports the best) and navigate through different graphs present on the left side of the Report. You will get all the test stats and graphs as shown below:

You may be interested: