This is one of the basic graphs and frequently use to debug the performance bottleneck. The error graph provides details about the type of errors and the time when they occurred. Error graphs could be the first point to kick off the investigation of performance issues. It helps to categorize the error using the response code. If the response code is HTTP 4XX then the issue is related to client-side input like wrong URL, header or any value. If the response code belongs to HTTP 5XX then it directs the investigation towards the server side.
The term used to show the Error graph in different tools:
- LoadRunner: Error per second Graph, Errors per Second (by Description) Graph, Error Statistics (by Description) Graph, Error Statistics Graph and Total Errors per Second Graph.
- JMeter: Error (Tabular Format) and Codes per second Graph
- NeoLoad: Error rate and Errors
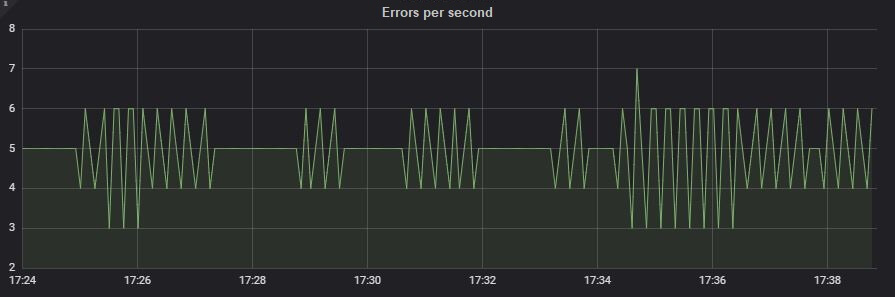
Error Graph axes represent:
- X-axis: This graph shows elapsed time on X-axis. The elapsed time may be relative time or actual time as per the setting of the graph. The X-axis of the graph also shows the complete duration of the test (without applying any filter).
- Y-axis: It represents the number of errors at a particular time.
How to read:
The graph line shows the error count per unit of time i.e. per second, per minute etc. If the graph allows then you can click on the line and see the description of the error at the bottom of the graph. With the help of an error description, try to investigate the root cause of the issue. In case you do not have access to the server log then provide the error timestamp to the person who has the right to check the server logs and ask him to provide more details of the event that occurred at the given timestamp.
Merging of Error graph with others:
- With Users graph: You can merge the Error Graph with User graph to get the user count when the error occurred.
- With Response Time graph: The response time graph can be merged with the Error graph to see the impact of errors on the performance time of requests.
- With Throughput: The error graph can be merged with the Throughput graph so that you can get the impact of errors on server data.
You may be interested: