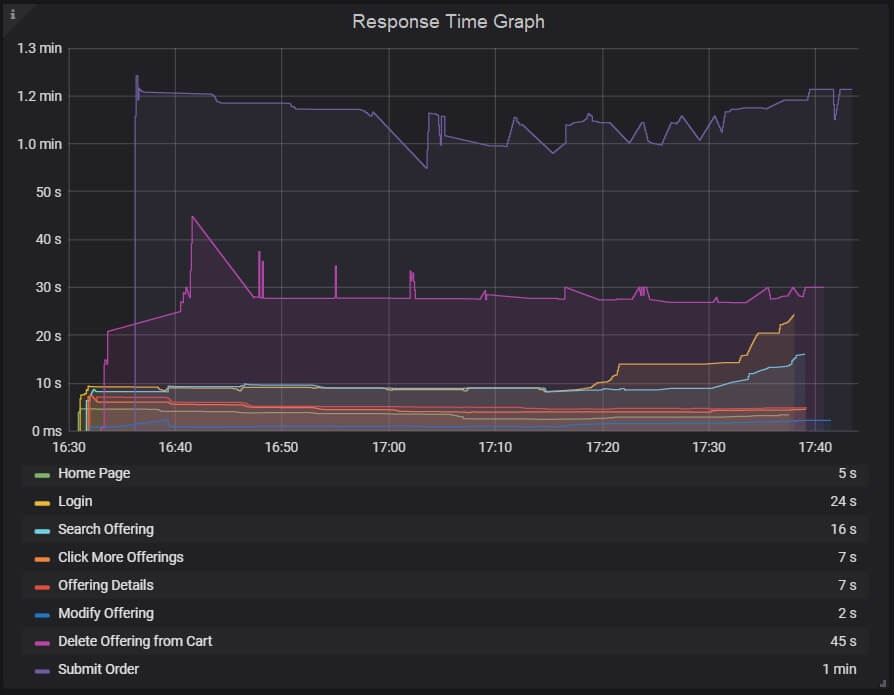
Response time graph gives a clear picture of overall time including requesting a page, processing the data and getting the response back to the client. As per PTLC (Performance Test Life Cycle), the Response time NFRs should be discussed and agreed upon during the NFR gathering phase and then compared with the actual response time which is observed during the test. Many times the application is brand new and does not have any response time NFRs, in such a case you need to adopt the Step-up Load approach. During the step-up test, you have to note down the response time pattern at different loads and share the analysis with the business analyst (BA) to get confirmation on the acceptance of the result.
Generally, the response time of a website at an average user load falls in the range of 3 to 5 seconds although for a web service, it is less than 1 second or even in milliseconds.
Type of Response Time Graphs:
You may get two types of response time graphs, one shows the response time of each request on a webpage whereas another shows the response time of the transactions. To remind you a transaction may contain multiple requests.
A response time graph may contain the name of transactions (requests), average response time, min and max response time, X%tile response time etc.
Important Tip: Response Time includes network delay, server processing time and queue time. Read More …
Every performance testing tool has its own term to represent the response time graph, some of them are below:
- LoadRunner: Average Transaction Response Time Graph
- JMeter: Response Times Over Time
- NeoLoad: Average Response Time (Requests) & Average Response Time (Pages)
Response Time Graph axes represent:
- X-axis: It shows the elapsed time. The elapsed time may be relative time or actual time as per the graph’s setting. The X-axis of the graph also shows the complete duration of the test (without applying any filter).
- Y-axis: It represents the response time in second or millisecond metrics.

How to read:
You can see multi-colour lines in the response time graph. These lines show the response time of the individual transaction or request along with the time. Hover the cursor on the line to get the response time value at a particular time. In this graph, you have to read the peak and nadir point of the lines which show the highest and lowest value of response time. The peak point in the graph indicates a delay in getting the response whereas the nadir point indicates the quickest response. A delay in the response may be due to high user load, server or network issue which needs further investigation. A graph with constant response time shows the stability of the application at the given load.
Apart from the stability, another important thing is all the defined response time NFRs should be met. A flat line of response time within SLA shows the application may perform as expected on the other hand fluctuation represents performance may vary from time to time.
The bottom table may have some columns like line colour, min, max, average, 90th percentile, deviation etc. The numbers in the table are used to validate the defined NFRs.
Remember: Table numbers may change on changing the granularity of the graph.
Merging of Response Time Graph with others
- With No. of users graph: You can merge the response time graph with user graph to identify the impact of user load. An increase in the user load may increase the response time but it should not breach the NFR. In the steady state with the same load, response time should not have a high deviation value.
- With Throughput graph: Merge the response time graph with throughput graph. You may find different patterns here:
- Increase in Throughput along with Response time: This situation is possible when users are ramp-up.
- Increase in Throughput with the decrease in Response time: This situation may occur when the system is recovered and started responding too fast.
- Constant Throughput with the increase in Response time: The reason may be a network bandwidth issue. If the network bandwidth is reached at its max then it causes a delay in transferring the data. Therefore throughput makes a flat line (max bandwidth) and response time makes a top-headed inclination.
- Decrease in Throughput with an increase in Response time: If you see in the graph, throughput decreases with the increase in response time then investigate at the server end.
- With Error Graph: Response time graph when overlaid with error/second graph then you can easily identify the exact time when the first error occurred as well as the time until the error lasts. You can also check whether response time increases after the first error appeared. Usually, an increase in error % during ramp-up indicates an error due to user load. If an error is identified during mid of steady-state then this indicates a server-side bottleneck.
Remember: Before making any conclusion, you should properly investigate the root cause of the performance bug by referring to all the related analysis graphs.
You may be interested:

