Network-side performance result analysis is a follow-up to Client and Server performance analysis and tuning efforts that I have discussed in the previous articles (Performance Test Result Analysis Basic Level and Performance TestResult Analysis Intermediate Level). Once you tested and optimized the client and server-side performance but still not getting the desired result, then look at the performance of the network.
When you are ready to examine the network’s components, start by checking networking latency, network bandwidth and throughput. For more information about these three important parameters visit my blog Why so confused with Latency, Bandwidth and Throughput.
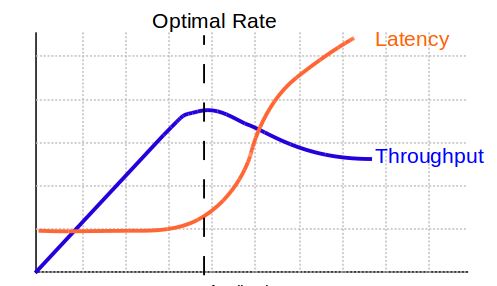
In general, network bandwidth is a common bottleneck which can be identified by analyzing latency and throughput graphs. Refer to the below graph showing the typical bandwidth bottleneck in the network:
Network hardware also plays an important role to speed up the transfer of requests/responses between client and server.
Example: To maximize the benefits of Windows 2000 networking performance enhancements, use adapters that support task offloading capabilities (checksum offloading, IP Security (IPSEC) offloading, or large send offloading) and interrupt moderation.
What are the common Network Bottlenecks?
- Client-network interface
- Server network interface
- Network bandwidth
- Network topology
- Inefficient configuration
How to identify Network Performance bottlenecks?
To confirm network performance issues (especially bandwidth issues) you have to look into the Network latency graph by merging it with the throughput graph. If latency increases without an increase in throughput then it’s a Network Bandwidth issue. Refer to the below figure:

A fair Throughput vs latency graph is given below which shows sufficient network bandwidth:

There could be many more issues in the network like Packet dropped, Datagrams dropped, Failure of connection, Failure of networking hardware etc. which you can find out with the help of Network Monitoring tools.
Network Monitoring Tools
There are many tools which could be used to monitor network performance and identify the issue. I have listed some of the tools below:
- Free Website Monitor
- Microsoft Network Monitor
- OpenNMS: Open Source
- Nagios: Open Source
- Fiddler
- WireShark
- SolarWinds
You can refer given links to get more details about network monitoring tools and how to use to detect the issue.
What are the Counters for Network Monitoring?
Some of the generic network performance counters are:
- Network Bandwidth
- Network Utilization (%)
- Server – Bytes Received/sec
- Server – Bytes Sent/sec
- Packets Received/sec
- Packets Sent/sec
- Output Queue Length
- Packets dropped/sec
- IP – Datagrams Received/sec
- IP – Datagrams Sent/sec
- Dropped Datagrams/sec
Additional Counters:
- UDP
- Segments Received/sec
- Segments Sent/sec
- TCP
- Frames Sent/sec
- TCP – Frames Received/sec
- Packets
- Outbound Discarded
- Outbound Errors
- Received Discarded
- Received Errors
Some important points to be remembered:
- Solving bandwidth is easier than solving latency.
- If throughput and bandwidth are nearly equal, it means the full capacity of the network is being used.
- An increase in response time with a flat throughput graph shows a network bandwidth issue. This bottleneck can be rectified by adding extra channels i.e. by increasing network bandwidth
- Ideally, consistent throughput indicates an expected capacity of network bandwidth
- If you have low latency, but you have a small bandwidth, it’ll take longer for data to travel from point A to point B compared to a connection that has low latency and high bandwidth.
- Latency is affected by connection type, distance and network congestion