The last post (Performance Test Workload Modelling) described the basics of Workload Modelling and the activities performed during this phase. Sometimes this phase is also known as the Performance Test Scenario creation phase. Let’s try to understand this phase with some practical examples. This post will describe the steps to design the workload model in Performance Testing.
Now, this is PerfMate’s turn to explain things practically with the help of his project (PerfProject). PerfMate already has the requirement captured during the NFR gathering phase. He uses these NFRs to create a workload model for each scenario. For a quick reference, the final NFRs are pasted below:
| NFR ID | Category | Description | Impact to |
| NFR01 | Application | The solution must be able to support 500 active users. 1. Admin: 4 (2 for seller and 2 for product approval) 2. Seller: 50 3. Buyer: 438 4. Call Center: 8 |
1. Admin 2. Seller 3. Buyer 4. Call Center |
| NFR02 | Application | The solution must be able to support the future volume of active users i.e. 2634 1. Admin: 10 2. Seller: 100 3. Buyer: 2500 4. Call Center: 24 |
1. Admin 2. Seller 3. Buyer 4. Call Center |
| NFR03 | Application | The solution must be performed well during a long period of time with average volume. i.e. 304 1. Admin: 3 2. Seller: 15 3. Buyer: 278 4. Call Center: 8 |
1. Admin 2. Seller 3. Buyer 4. Call Center |
| NFR04 | Application | The solution must be able to support the spike load of the buyer and seller during the sale period. 1. Admin: 3 2. Seller: 23 3. Buyer: 834 4. Call Center: 8 |
1. Admin 2. Seller 3. Buyer 4. Call Center |
| NFR05 | Application | Admin gets an average of 200 requests per hour every time. | 1. Admin |
| NFR06 | Application | The number of orders: 1. Peak Hour Volume: 1340 2. Sale Hour Volume: 2830 3. Future Volume: 7500 4. Average Volume: 600 Note: 4% of the users cancel the order in every scenario. |
1. Buyer |
| NFR07 | Application | Sellers add an average of 180 products per hour and delete 18 existing products every hour | 1. Seller |
| NFR08 | Application | The call center employees get 40 complaints per hour | 1. Call Center |
| NFR09 | Application | The response time of any page must not exceed 3 seconds except stress test | 1. Admin 2. Seller 3. Buyer 4. Call Center |
| NFR10 | Application | The error rate of transactions must not exceed 1% | 1. Admin 2. Seller 3. Buyer 4. Call Center |
| NFR11 | Server | The CPU Utilization must not exceed 60% | 1. Web 2. App 3. DB |
| NFR12 | Server | The Memory Utilization must not exceed 15% (Compare pre, post and steady-state memory status) | 1. Web 2. App 3. DB |
| NFR13 | Server | The disk Utilization must not exceed 15% (Compare pre, post and steady-state memory status) | 1. Web 2. App 3. DB |
| NFR14 | Server | There must not any memory leakage | 1. Web 2. App 3. DB |
| NFR15 | Application |
Buyers order at the average rate of 1. Peak Hour Rate: 3.06 products per hour 2. Sale Hour Rate: 3.39 products per hour 3. Future Volume: 3 products per hour 4. Average Volume Rate: 2.15 products per hour |
1. Buyer |
Steps to Design an efficient workload model in Performance Testing:
Firstly, PerfMate starts with the Load Test Scenario:
Refer to NFR01, Load Test must have 500 users load. Hence the load distribution among the scripts as per NFR01 is:
| Role | User Count | Script Name | User Distribution |
| Admin | 4 | adm_seller_request | 2 |
| adm_product_request | 2 | ||
| Seller | 50 | slr_add_product | 45 |
| slr_delete_product | 5 | ||
| Buyer | 438 | byr_buy_product | 420 |
| byr_cancel_order | 18 | ||
| Call Center | 8 | cce_register_complain | 8 |
Calculation of User distribution:
- As per NFR01, 2 admins are responsible for seller approval and 2 admins are responsible for product approval. Hence user count is distributed 50%-50%. During the test, 2 users will execute the adm_seller_request script and another 2 users will execute the adm_product_request script.
- As per NFR07, 10% of total sellers will perform the product deletion activity, so 5 sellers (=10% of 50) will delete the existing product through the slr_delete_product script and the remaining 45 sellers will add new products through the slr_add_product script.
- As per NFR06, 4% of the total buyer count cancel the order, so 18 buyers (round-off 4% of 438) will cancel their orders through the byr_cancel_order script and the |remaining 420 buyers will place the order through byr_buy_product script.
- All 8 call center employees will do the same task, so no distribution for the call center scenario.
Get the Iterations per second metric:
The next step is to get the iterations per second value. Request or order count can provide the iteration count which is available in NFR05, NFR06, NFR07 and NFR08. PerfMate can calculate the iterations per second metric using the iteration count by dividing the figure by 3600 (only when the iteration count is in per hour).
| Role | User Count | Script Name | User Distribution | Requests/Orders per hour (Iterations per hour) | Iteration per second = Iteration per hour / 3600 |
| Admin | 4 | adm_seller_request | 2 | 100 | 0.028 |
| adm_product_request | 2 | 100 | 0.028 | ||
| Seller | 50 | slr_add_product | 45 | 180 | 0.05 |
| slr_delete_product | 5 | 18 | 0.005 | ||
| Buyer | 438 | byr_buy_product | 420 | 1340 | 0.372 |
| byr_cancel_order | 18 | 54 | 0.015 | ||
| Call Center | 8 | cce_register_complain | 8 | 40 | 0.011 |
| Total | 500 | 500 | 1832 | 0.51 |
As mentioned in the last post, user count and iterations per second are two basic metrics and must for workload modelling or scenario creation. PerfMate got these basic metrics. Now, see how he will prepare the scenario with the help of other calculative metrics.
Get the number of transactions metric for each script:
Since PerfMate has completed all the scripts at this stage, he can easily get the count of total transactions available in the script.
| Role | User Count | Script Name | User Distribution | Request/Order per hour | No. of transactions in each iteration |
| Admin | 4 | adm_seller_request | 2 | 100 | 7 |
| adm_product_request | 2 | 100 | 7 | ||
| Seller | 50 | slr_add_product | 45 | 180 | 7 |
| slr_delete_product | 5 | 18 | 7 | ||
| Buyer | 438 | byr_buy_product | 420 | 1340 | 8 |
| byr_cancel_order | 18 | 54 | 6 | ||
| Call Center | 8 | cce_register_complain | 8 | 40 | 7 |
| Total | 500 | 500 | 1832 |
Get the End-to-End Response Time metric:
The next step is to find out the end-to-end response time. Here, end-to-end response time refers to the time to complete 1 iteration. Initially, the response time metric is unknown or targeted; rather than actual. Now, the performance tester needs to execute each script with one user and get the response time. It could be a chance that the response time captured by replaying the script is different than the response time observed during the test. If so then this may impact the expected number of iteration metrics. To overcome such a situation, a performance tester needs to plan 1 sanity test to capture the actual response time. If he runs the script without actual response time then the chances of over/under-hitting to the server are more.
The main purpose of the sanity test is just to get the end-to-end response time. This test could be run without Think Time or pacing.
PerfMate executes a sanity test and gets the below numbers:
| Role | Script Name | End to End Response Time (in seconds) |
| Admin | adm_seller_request | 15 |
| adm_product_request | 15 | |
| Seller | slr_add_product | 18 |
| slr_delete_product | 10 | |
| Buyer | byr_buy_product | 51 |
| byr_cancel_order | 34 | |
| Call Center | cce_register_complain | 29 |
Calculation of Think Time metric:
PerfMate ran the scripts and got the end-to-end response time for all the test cases. The scripts were executed without Think Time which did not depict a real-time situation. To make the scenario real-time PerfMate needs to add think time between each step (transaction). Think time is something which he can assume as per the contents or activities done on a particular page by a user. Think time between two pages shows that a user halts on the previous page to read the page content or to fill the form or to wait for the whole page loading etc. It could be fixed or random, depending on performance testing tool settings.
Now, PerfMate assumes 3 second fixed think time between each transaction for all the scripts. So the total think time will be:
| Role | Script Name | No. of Transactions | Think Time (in seconds) | Total Think Time = Think Time*(No. of Transactions-1) |
| Admin | adm_seller_request | 7 | 3 | 18 |
| adm_product_request | 7 | 3 | 18 | |
| Seller | slr_add_product | 7 | 3 | 18 |
| slr_delete_product | 7 | 3 | 18 | |
| Buyer | byr_buy_product | 8 | 3 | 21 |
| byr_cancel_order | 6 | 3 | 15 | |
| Call Center | cce_register_complain | 7 | 3 | 18 |
Total Think Time = Individual Think Time * (No. of Transactions – 1)
If the think time values are different between each transaction then simply sum up all the think time values to get the total think time.
Total Think Time = (Think Time 1) + (Think Time 2) + (Think Time 3) + …….. + (Think Time N)
Calculation of Pacing metric:
Now, PerfMate can easily calculate the pacing with available metrics using the below formula:
Pacing = (No. of Users / Iterations per second) – (End to End Response Time + Total Think Time)
| Role | Script Name | No. of Users | Iterations per second | End-to-End Response Time | Total Think Time | Pacing |
| Admin | adm_seller_request | 2 | 0.028 | 15 | 18 | 38.42 |
| adm_product_request | 2 | 0.028 | 15 | 18 | 38.42 | |
| Seller | slr_add_product | 45 | 0.05 | 18 | 18 | 864 |
| slr_delete_product | 5 | 0.005 | 10 | 18 | 972 | |
| Buyer | byr_buy_product | 420 | 0.372 | 51 | 21 | 1057 |
| byr_cancel_order | 18 | 0.015 | 34 | 15 | 1151 | |
| Call Center | cce_register_complain | 8 | 0.011 | 29 | 18 | 680.27 |
Now, PerfMate has all the required values to create a load test scenario by following the above-mentioned steps to design a workload model.
Decide Steady State, Ramp-up & Ramp-down Time:
As per PerfProject’s Performance Test Plan, the duration of steady state (when all the users are ramped-up) for a load test is one hour. The ramp-up time is decided based on no. of users for an individual scenario. Here, PerfMate considers the following delay time, ramp-up, steady state and ramp-down time. The only important thing that should keep in mind is that in a combined script scenario, all the scripts should get into the steady state at the same time so that the desired load can be applied at the same point of time and measured the true performance of the application.
| Script Name | No. of Users | Initial Delay (in minutes) | Ramp-up | Steady state (in minutes) | Ramp-down |
| adm_seller_request | 2 | 9 | 1 User per minute | 60 | 1 User per minute |
| adm_product_request | 2 | 9 | 1 User per minute | 60 | 1 User per minute |
| slr_add_product | 45 | 6 | 9 Users per minute | 60 | 10 Users per minute |
| slr_delete_product | 5 | 8 | 2 Users per minute | 60 | 1 User per minute |
| byr_buy_product | 420 | 0 | 20 Users per 30 sec | 60 | 30 Users per 10 sec |
| byr_cancel_order | 18 | 6 | 4 Users per minute | 60 | 6 Users per minute |
| cce_register_complain | 8 | 6 | 2 Users per minute | 60 | 4 Users per minute |
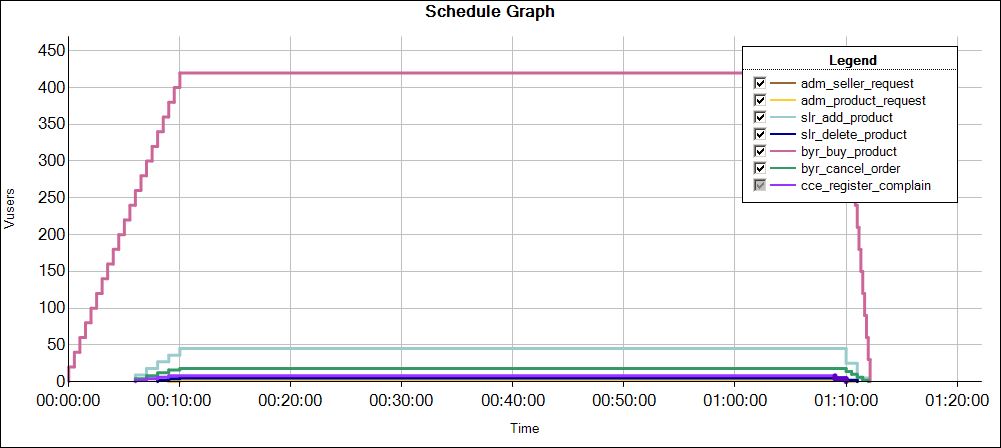
At last, the PerfMate got the workload model for the load test. The user graph looks like this:
PerfProject’s workload model for Load Testing:

Similarly, by following the above-mentioned steps to design a workload model the stress test scenario can be prepared and the graph looks like this:
PerfProject’s workload model for Stress Testing:

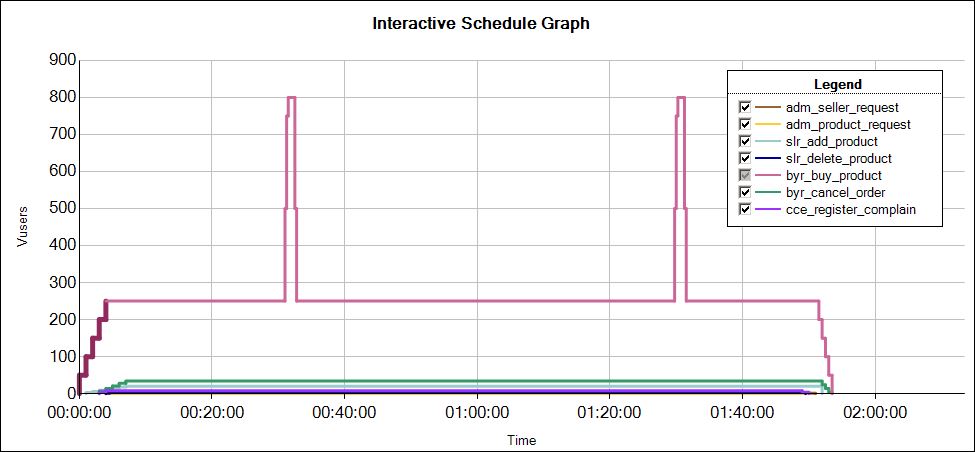
Similarly, by following the above-mentioned steps to design a workload model the spike test scenario can be prepared and the graph looks like this:
PerfProject’s workload model for SpikeTesting:

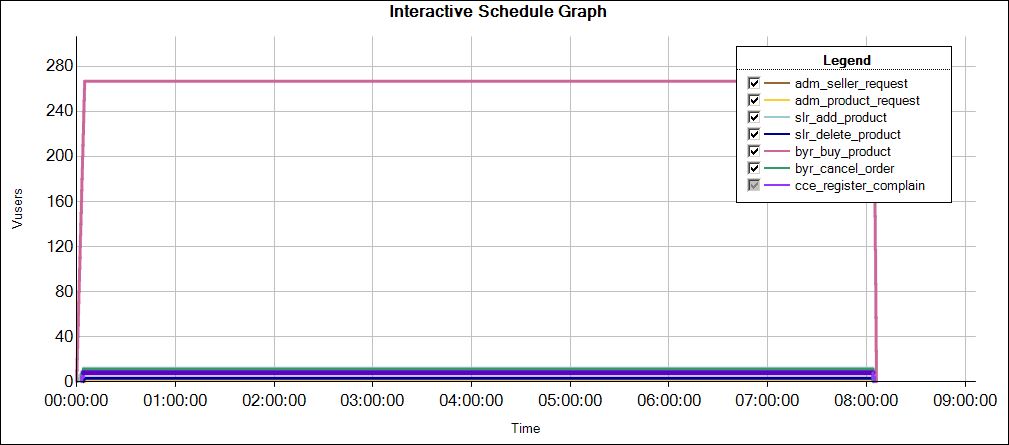
Similarly, by following the above-mentioned steps to design a workload model the endurance test scenario can be prepared and the graph looks like this:
PerfProject’s workload model for Endurance Testing:

PerfMate designed the workload models for all the required scenarios and arrived at the closure of the Workload Modelling phase. Now, he is ready to jump onto the next phase of Performance Testing Life Cycle i.e. Performance Test Execution.


Could you please explain how No. of transactions in each iteration column values be calculated.
I understand Get the Iterations per second metric: but below that how No. of transactions in each iteration is calculated.
Hi Amit,
This value comes from the script. You need to count the transactions like login, search, logout etc. in the test script to get this value.
Thank you so much for your reply. I didn’t expect that the response of this forum is so promt and interactive. I was travelling from last two weeks so couldn’t get chance to visit the page. But when i opened the page today and found that the you responded on same today, it made me happy.
Thanks again for your reply!
Welcome, Amit!
How did you come out the values of initial delay(in minutes) for all the scripts.
Hi Amit,
This is a reverse calculation to sync the steady-state of all the script.
Could you please explain initial delay and ramp up period? by taking example of 2 or 3 scenarios
Hi Rajitha,
Initial Delay: The delay to start a particular scenario or test. Let say you have given 60 seconds as initial delay so when you start the test, that particular scenario will kick-off after 60 seconds.
Ramp-up: How long it should take to get all the threads/Vusers started. If there are 10 threads/Vusers and ramp-up time of 100 seconds, then each thread/Vuser will begin 10 seconds after the previous thread/Vuser started, for a total time of 100 seconds to get the test fully up to speed.
Hi Perfmatrix,
Could you please explain the reverse calculation to sync the steady-state.
Hi Naga,
The script ‘byr_buy_product’ has a large number of users and will take 10.5 (around 11 minutes) to ramp-up all the users. Hence all the users in the scenario should get ramp-up in 11 minutes. Now do the reverse calculation by considering 11 minutes as a benchmark. The first script has only 2 users and ramp-up rate is 1 user per minute. It would need total 2 minutes to ramp-up the users. Now to calculate the initial delay, subtract 2 from 11, so the answer is 9. Apply the same to all the script.
How did u calculated Initial Delay (in minutes) , Ramp-up and Ramp-down
Hi Rajani,
It is explained in the above comments
How do you calculate iterations per second in the above given example?
Hi Zahid,
It is based on Little’s law.
What should be our approach to prepare workload model for a new application that is in building phase?
We don’t have any existing server logs for it. How to determine the TPS for it and then calculate the user load for it.
It will be great if u can provide us an example to explain the approach.
Hi Sudhir,
In that case, you need to apply the Step-up approach.
Article: https://www.perfmatrix.com/step-up-performance-test/
Video: https://youtu.be/lijFWWGJauU
Thank you for the excellent articles on PT and PE. I have a query regarding setting the delay time. Consider I have 5 scripts in my load test scenario. Each with different number of vUsers. Once the test starts, how can we know which vUser starts first? My ramp-up setting is 5 users every 2 minutes. From which script will the first 5 users start ramping up. This will impact the calculation of delay time. Am I correct? Please clarify.
Script 1 – 2 Users
Script 2 – 10 Users
Script 3 – 48 Users
Script 4 – 20 Users
Script 5 – 2 Users
Hi, I have the same doubt. Little’s law says No. of users = IPS * Pacing. Here we do not know the pacing yet. To calculate pacing, we need IPS. Really confused on how to determine IPS.