
You would have used the correlation for dynamic values while preparing scripts in Micro Focus LoadRunner. Have you ever heard about graph correlation? If your answer is No then refer to Graph Correlation post first. Because Graph correlation is the base of the ‘Correlate Method’.
Graph correlation is a perfect feature of the Micro Focus Analysis tool to analyse the test result and find out the issue. When you do graph analysis in separate windows, it is difficult to synchronize the time frame and also, it is hectic work to swap the windows every time. To solve this problem Micro Focus Analysis Tool has a graph merging option. This option merges the graphs and provides a single view which is helpful for issue identification. In Apache JMeter, you can open a result file (.csv/.log/.jtl) in the composite graph listener to use this feature.
Graph correlation is about establishing a relationship between performance metrics by comparing the data. The software system is always complex with multi-tier architecture, different technologies and interfaces with internal or external systems. So the easy way to do correlation is to compare the end-user performance with the server-side metrics. It is like comparing the trend from one set of metrics like response time with other metrics like webserver CPU utilization.
What do we get by correlating the graph?
When you see a relationship between two sets of data an increase in response time corresponds to an increase in no. of users and heap size that uncovers an area for further investigation and analysis. Refer to the below graph:
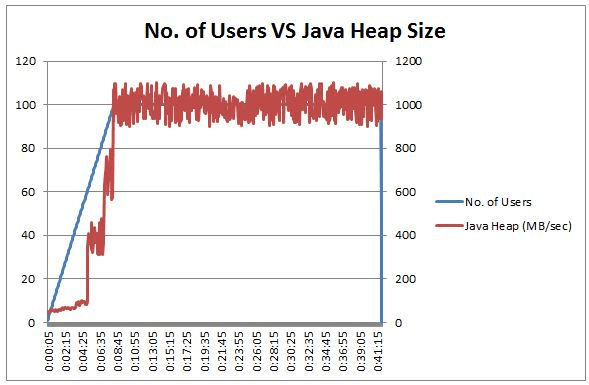
It shows an association between client-side metrics and the server data. The graph shows that when no. of users becomes 40 then a sudden increase in heap size and similar we can see when users become 70 and 100. It shows that the garbage collector needs investigation.
In a similar fashion, you can merge the client and server-side graphs to identify the exact bottleneck.
What are the best graph combinations in Correlate Method?
Case 1: High Response Time without error
Correlate the Response time graph with the Data Throughput graph, Memory Utilization graph and DB Query Processing Time graph
Case 2: Error
Correlate the Error graph with the Response Time graph, CPU Utilization graph, Memory Utilization graph and DB Query Processing Time graph
Along with the above correlation of the graph refer to Heap Dump, Thread Dump and GC for more clarity on the root cause.
Note:
- In an ideal scenario, if metrics are directly proportional then y-axis graph lines should follow each other. Else the opposite trend should be observed when metrics are inversely proportional.
Example: During steady-state, Throughput and Hits per second graphs follow each other while Errors per second and Average Response Time graphs follow the opposite direction - A linear line in the forward direction indicates good results and the application’s stability whereas step-up, step-down and spike in the correlated graphs lead the investigation.
You may be interested:
- ComCorDEEPT Technique
- WHIWH Rule
- Compare Method
- Drill down Method
- Eliminate Method
- Extrapolation Method
- Pattern Method
- Trend Method