Drill down method is used to concentrate on one bottleneck at a time and narrow down the focus to a component by drilling down till you get the exact root cause. It is pretty much like starting your investigation at one point and drilling down further to see what exactly is the problem. This method can be applied to any type of component or any metric. This method also involves Compare and Correlate Methods.
Let’s try to understand this method with one example:
Example
I ran a test with 100 users, during ramp-up I saw a sudden increase in the end-to-end response time when the user count crossed 60 users.
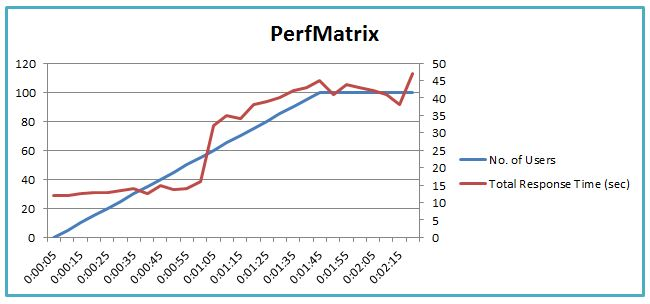
Now, my approach should be to check whether one transaction is contributing to high response time or all the transactions creating the issue. I will see the average response time graph (or response time over time graph).

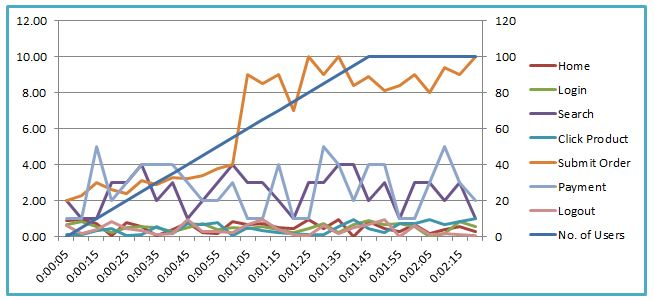
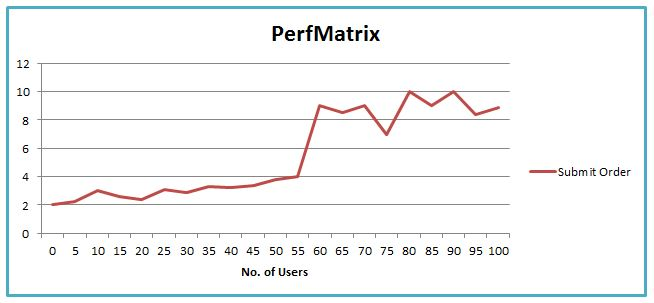
So here is the culprit. Referring to the above graph you can see a plateau is formed by the response time of the “Submit Order” transaction at the exact same time (0:00:55) when the user count crossed 60 users. Do you want to validate? Refer to the below correlation and overlay graphs:
Now, I need to drill down more to get the root cause of the issue. Let’s check the throughput graph first.
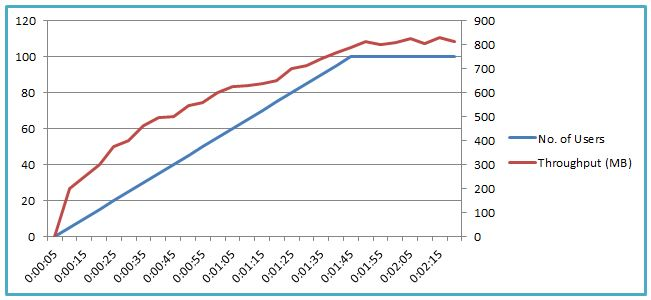
The throughput looks fine, with no degradation. A slight fall in throughput ramp-up at the 55th second due to high response time, but it does not imply any network bottleneck. Now, my investigation will move towards the server-side and will analyse server-side graphs. Let’s check the CPU Utilization graph:

Yes, CPU utilization increased and reached 90% at the 55th second. Can we have a look at the Java Heap graph?

Heap size is increasing, but is it increasing even when we have all users in steady-state?

The answer is Yes; after overlaying no. of users and the Java heap size graph. Hence you got bottleneck “Submit Order functionality is creating new objects and occupying more and more heap space without releasing it. Heap size keeps on increasing due to improper GC work”.
You can also drill down any performance issue by using some profiling tools to get the exact object name and recommend to developers to tune the application by debugging the bottleneck.
Conclusion:
Drill down method takes slightly more time than other methods but it finds out the exact root cause of the bottleneck. Hence many performance engineers use this method to fine-tune the application.
You may be interested: