
As per the ComCorDEEPT technique, ‘Compare’ is the first and foremost method of Performance Test Result Analysis. The ‘Compare’ method is a simple way to match the defined NFRs with the actual result. For Example, if the defined response time NFR for a Login page is 5 seconds and you observed the actual response time during the load test is 4.2 seconds then you can compare the defined vs actual response time and conclude the result. In this case, the actual response time is better than the expected one. Similarly, Transactions per second (TPS), Throughput, resource utilization etc. can be compared.
How does the ‘Compare’ method work when NFRs are not predefined?
For New Application: In such a case, you have to apply the step-up test approach. In this approach start the test with a small user load and increase the load until the application breaks. The pattern to increase the user load makes a step.
Compare the result of each step with the previous step and find out the deviation of the performance metrics like response time, throughput, number of errors etc.
For Existing Application: First, execute a test on the old (existing) code version and set baseline metrics then deploy the latest code and execute the test with the same load and compare the result with the baseline test result. The ‘Compare’ method is very useful for the Baseline-Benchmark test approach where you can do an apple-to-apple comparison. The baseline test result can be compared with the benchmark test result provided that both the tests were executed with the same user load and scenario configuration.
Likewise, you can apply the ‘Compare’ method in the absence of predefined NFR of new as well as existing applications.
How does the ‘Compare’ method help in analyzing the result?
Let’s take one example. There is one existing application which has a baseline test result from the previous release. During baseline test execution following were the NFRs:
No. of Users: 100
End to End Response Time: 40 seconds
TPS: 0.8 TPS
CPU Utilization: Below 70%
Java Heap Size: <500 MB
The same NFRs are still applicable for the latest code base but here we have some additional results (from baseline test) which will help to perform an apple-to-apple comparison.
Refer to the below graphs, the first column has a Baseline test result, the second column has Benchmark 1 test result and the third column has Benchmark 2 test result. Now, apply the compare method:
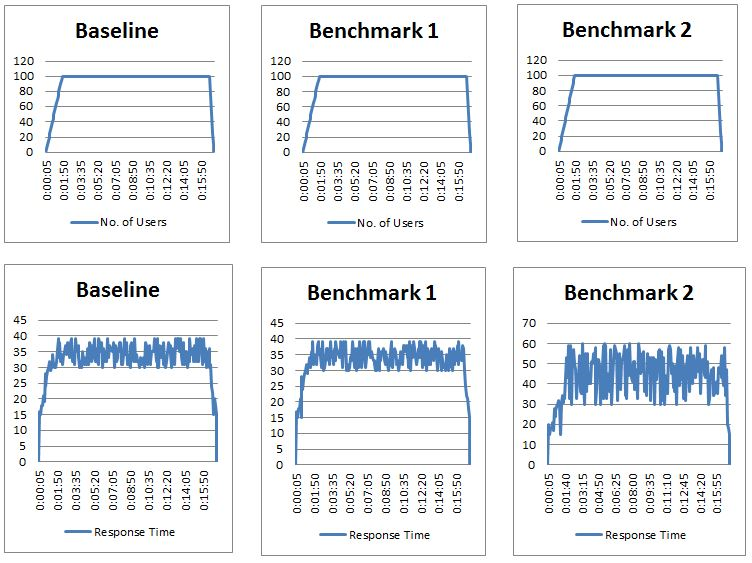
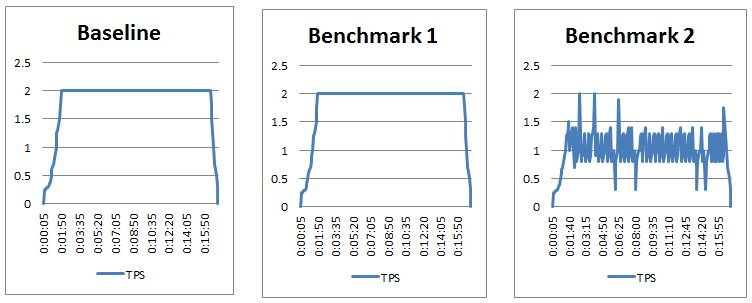

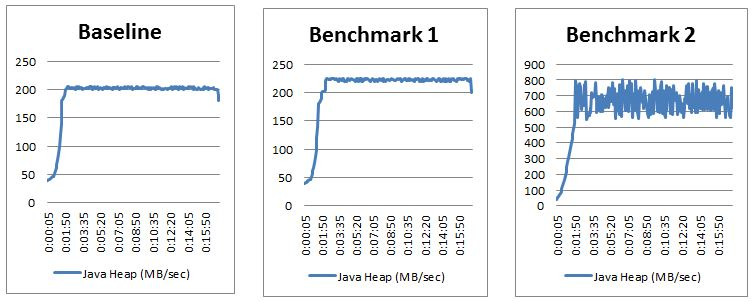
The comparison of client and server performance metrics helps to understand the acceptable thresholds for the system and its resources and figure out what is significantly different. The places where the differences appear are the areas to look for bottlenecks.
Hence by comparing benchmark test result 1 and 2 with either defined NFRs or baseline test result, we can conclude benchmark 1 test result met NFRs while the benchmark 2 test result breached NFRs due to the Java Heap Size issue which require further investigation to find out the exact root cause.
How to conclude the result?
After comparing all the important metrics, you will get to know which NFRs/Baseline test results met. Based on your analysis, if the results are under the acceptance limit then you can easily provide a GREEN sign-off. If some of the NFRs breach (with low or no risk) then provide AMBER sign-off with proper risk and recommendations. At last, if very few or none of the NFRs meets then provide the RED sign-off and highlight the risks.
You may be interested: