
How to add the user-defined Data Collector Set in PerfMon?
Following are the steps to add the user-defined Data Collector Set in PerfMon:
1. Launch the PerfMon Tool on the Windows machine
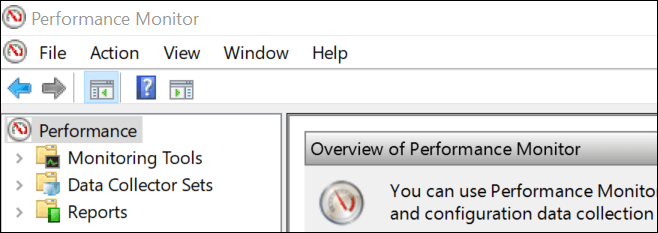
2. Performance -> Data Collector Sets -> User Defined. Right-click on ‘User Defined’
3. New -> Data Collector Set

4. A pop-up appears in which you have to insert the name of the Data Collector Set. (Example: CPU_DCS_1)
5. You can choose either ‘Create from a template’ or ‘Create manually’ as per your requirement. Refer to the below screenshot in which ‘Create manually’ was selected.
6. Click ‘Next’

7. Select the report data type. The ‘Performance counter’ provides the performance metrics of the resources, ‘Event trace data’ gives information about specific transactions and ‘System configuration information’ provides basic configuration information about the machine.
8. Click ‘Next’

7. Click ‘Add’ to select the needed counters on the page ‘Which performance counters would you like to log?’
8. Select the required counters from the list and click ‘Add >>’
9. Click ‘OK’

10. The selected counters will be added.
11. Change the ‘Sample Interval’ unit (if needed)
12. Click ‘Next’

13. Browse and set the path to save the collected data.
14. Click ‘Next’

15. If you want to start the performance stats collection then select ‘Start this data collector set now’ else select ‘Save and close’ and start it later.
16. Click ‘Finish’

17. The newly created data collector set is added under ‘User Defined’ and the report is available under ‘Reports’


18. Here is the report

19. Click on the ‘View Data in Performance Monitor’ to see the report in the graphical format

How to start/stop the Data Collector?
1. Select the Data Collector and click the ‘Run’ button from the menu bar

2. Select the Data Collector and click the ‘Stop’ button from the menu bar

Like this, you can add multiple custom Data Collectors and fetch the performance report.
You may be interested: