
PerfMon is an in-built performance monitoring tool for Windows System. It is a powerful, and often underutilized, tool. PerfMon provides a wide range of performance statistics and graphs for the Windows System. So, let’s start
How to launch PerfMon?
- Login to ‘Windows’ server
- Click on ‘Search’ or the ‘Magnifying Glass Icon’.
- Type ‘PerfMon’
- Click ‘Open’
- PerfMon tool will launch with the following screen
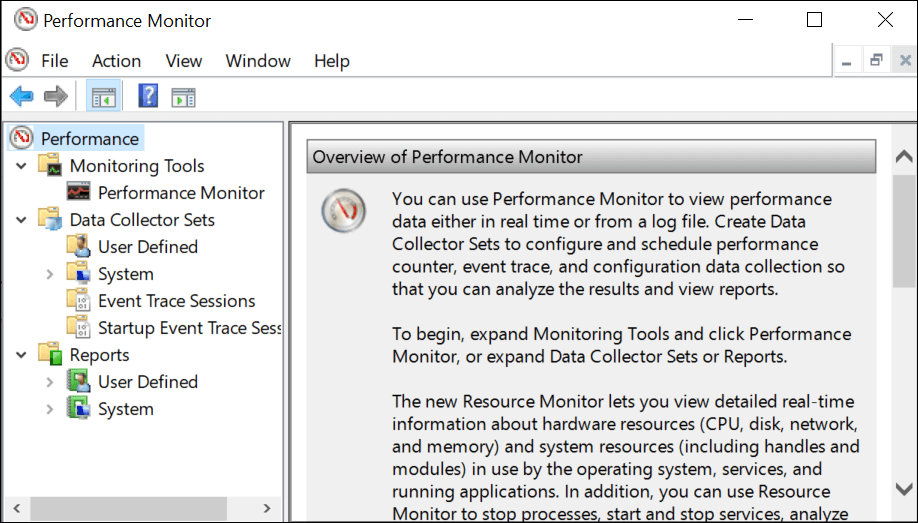
You will see:
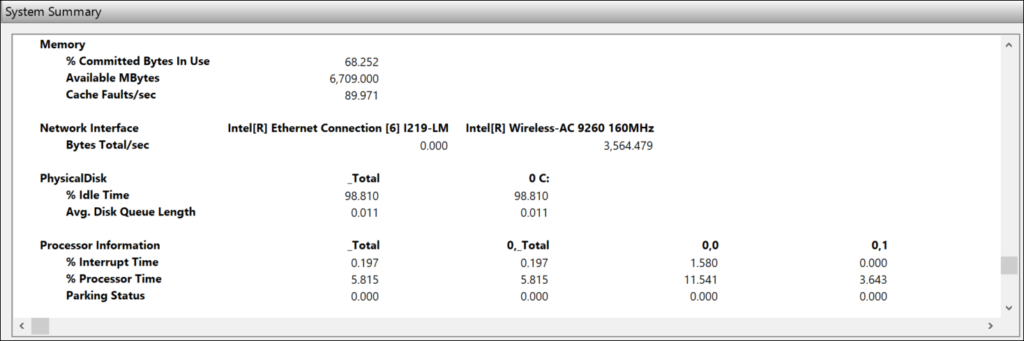
- Performance: It provides an overview of the system performance with metrics like Memory, Network Interface, Physical Disk and Processor Information. Also, you can add other Windows machine stats by right-clicking on the ‘Performance’. It will be added as a new tab under the ‘System Summary’ section. Refer to the Figure 02.
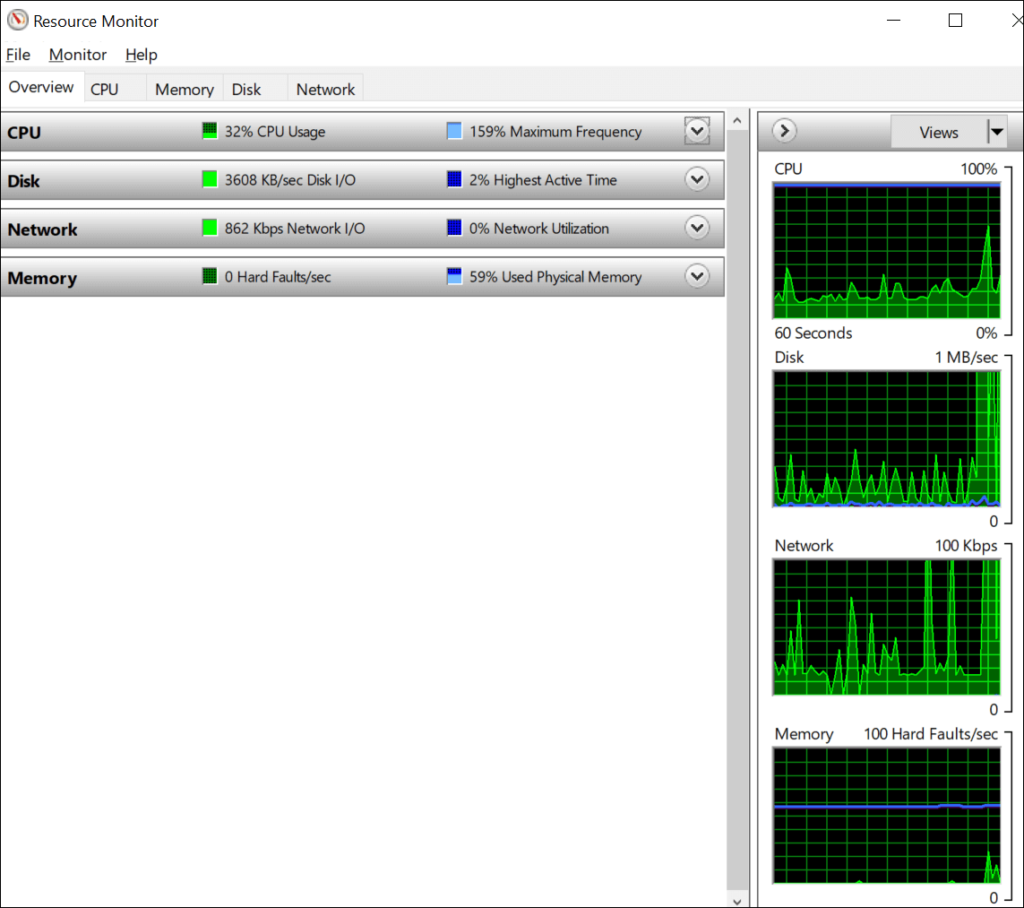
- Monitoring Tools: When you right-click on it you can see the ‘Resource Monitor’ and ‘View System Reliability’ options. The ‘Resource Monitor’ provides real-time resource utilization graphs for CPU, Memory, Disk and Network. Refer to the Figure 03. ‘View System Reliability’ provides a utility that allows one to see information about software updates and installations and it is more specific and useful to individual local Windows machines rather than servers.
- Performance Monitor: Real-time statistics can be viewed primarily via the Performance Monitor. The %Processor Time counter is the default one. However, by clicking the green + sign, you can add more counters. You can use this to keep an eye on whatever counters you choose in real-time.
- Data Collector Sets: Performance Counters, Event Traces and System Configuration Information are three types of Data Collector Sets.
- User Defined: It contains the list of all the user-defined Data Collector Sets.
- System
- System Diagnostics
- System Performance
- Event Trace Sessions
- Startup Event Trace Sessions
- Reports: The Reports section of the Performance Monitor is its last component.
- User Defined: The user-defined data of the Data Collector Sets are gathered here.
- System
- System Diagnostics
- System Performance
- Monitoring Tools: When you right-click on it you can see the ‘Resource Monitor’ and ‘View System Reliability’ options. The ‘Resource Monitor’ provides real-time resource utilization graphs for CPU, Memory, Disk and Network. Refer to the Figure 03. ‘View System Reliability’ provides a utility that allows one to see information about software updates and installations and it is more specific and useful to individual local Windows machines rather than servers.
Important Graphs:
Processor Graph:
How to add Processor Graph and related counters?
- Performance -> Monitoring Tools -> Performance Monitor -> Click ‘+’
- Select ‘Processor’ from the ‘Available Counters’ list -> Click ‘Add >>’ OR Expand the list under ‘Processor’ and select the required counters -> Click ‘Add >>’


Memory Graph:
How to add Memory Graph and related counters?
- Performance -> Monitoring Tools -> Performance Monitor -> Click ‘+’
- Select ‘Memory’ from the ‘Available Counters’ list -> Click ‘Add >>’ OR Expand the list under ‘Memory’ and select the required counters -> Click ‘Add >>’


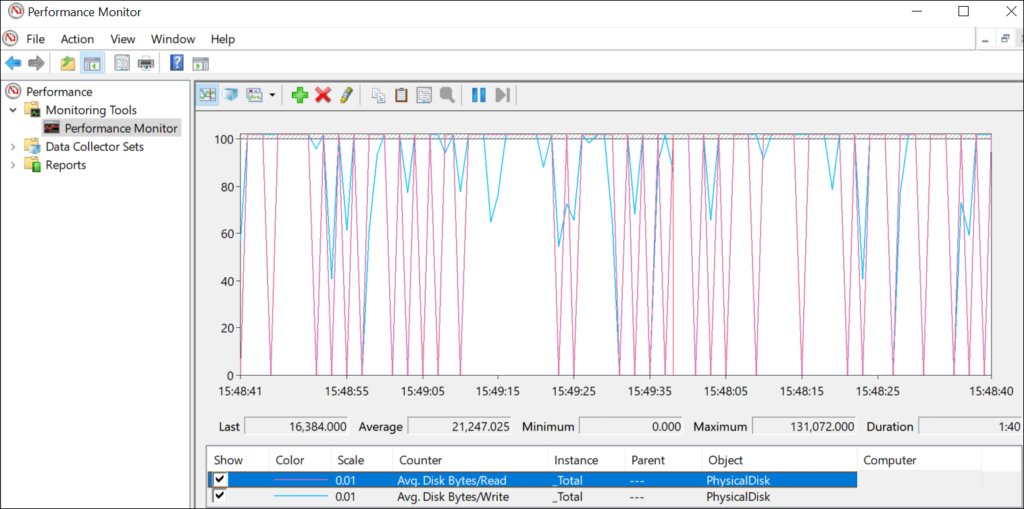
Physical Disk Graph:
How to add a Physical Disk Graph and related counters?
- Performance -> Monitoring Tools -> Performance Monitor -> Click ‘+’
- Select ‘PhysicalDisk’ from the ‘Available Counters’ list -> Click ‘Add >>’ OR Expand the list under ‘PhysicalDisk’ and select the required counters -> Click ‘Add >>’

You may be interested:
- Performance Testing Tutorial
- Performance Engineering Tutorial
- Apache JMeter Tutorial
- Neotys NeoLoad Tutorial