
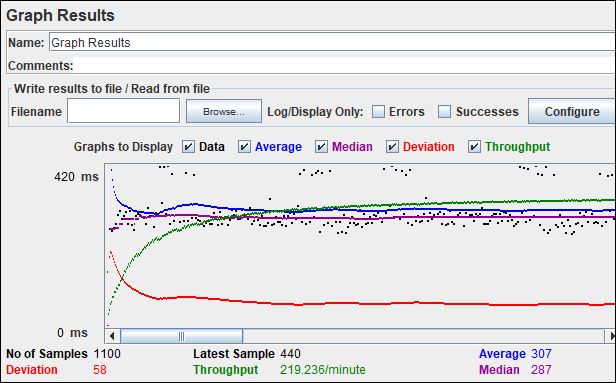
In JMeter, Graph Results Listener plots a graph between response time in milliseconds and elapsed time. The graph lines show the response time of all the requests (Data), the average response time (Average), the median of response time (Median), deviation in the response time (Deviation) and no. of samples per minute (throughput). The summarized figures can be seen at the bottom of the graph.
How to add ‘Graph Results’?
Follow the below steps:
- Select the appropriate element where you want to add the listener
- Test Plan
- Thread Group
- Controller
- Sampler
- Right-click on the element
- Hover the cursor on ‘Add’
- Hover the cursor on ‘Listener’
- Click ‘Graph Results’
Scope: Graph Results Listener can be added at any level is sampler level, transaction level, thread level or test plan level. The graph will be displayed as per the scope only. If the listener is added under a sampler then it will show the graph lines of the parent sampler only. If it is added under a transaction level then it will show the graph for all the samplers under that particular transaction controller. Similarly, adding a graph results listener at the test plan level provides the graph for all the requests under the test plan.
Uses: This listener provides high-level data which can be used only for a summary purpose. The number of samples includes transaction controller count too, so it does not provide an accurate request count. The unavailability of filter options makes this listener poorer.
Recommendation: It is not recommended to keep this listener enabled during the test run. Post-test execution graph can be analysed by browsing the log file.
You may be interested:
- Performance Testing Tutorial
- Performance Engineering Tutorial
- Micro Focus LoadRunner Tutorial
- NeoLoad Tutorial