
JMeter Arrivals Thread Group element is specially created for the case where no. of orders to be submitted in an hour; is known.
For example, 2000 orders are purchased on an e-commerce every day, 1000 movie tickets are booked every hour on a movie ticket booking application, 10 licenses of software are purchased every minute etc.
In such types of scenarios, more preference is given to the quantity of order irrespective no. of users. Apache JMeter adjusts the number of threads according to the target arrival rate. Now, here it is necessary to understand the arrival rate.
The “Arrivals Rate” word is used for the rate of iteration (order submission). If I say 10 licenses are purchased in a minute it signifies that 10 iterations need to be started and completed in 1 minute. Hence the arrival rate will be 10/min. If I say 1000 movie tickets booked in an hour (16.6 = ~17/min), then it signifies that around 17 iterations should be started and completed in 1 minute, so the arrival rate will be 17.
One point to be noted here, I did not talk about the number of users in the above-mentioned scenarios, it means that the arrival rate can be controlled by 1 or multiple threads. In case the arrival rate is too high then you can cap the number of threads. This option is available. Another best thing about the Arrivals Thread Group is all the active threads are stopped in a graceful manner at the end of the test. i.e. all the threads complete their iteration and then exit from the test. Now, let’s try to discuss this more in detail.
How to download the ‘Arrivals Thread Group’ plug-in?
- Click on the link to download Arrivals Thread Group JMeter Plugin
- Unzip the folder
- Copy the file jmeter-plugins-cmn-jmeter-<version>.jar to lib folder of Apache JMeter
apache-jmeter-<version> –>lib –> Paste jmeter-plugins-cmn-jmeter-<version>.jar - Copy the files jmeter-plugins-casutg-<version>.jar and jmeter-plugins-manager-<version>.jar to ext folder of Apache JMeter
apache-jmeter-<version> –>lib –>ext -> Paste jmeter-plugins-casutg-<version>.jar and jmeter-plugins-manager-<version>.jar
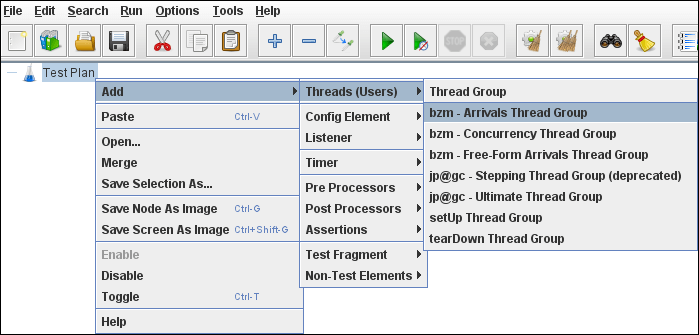
How to add an ‘Arrivals Thread Group’ in Test Plan?
- Select the ‘Test Plan’ node
- Right-click on the ‘Test Plan’ node
- Hover the mouse on ‘Add’
- Hover the mouse on ‘Thread (Users)’
- Click ‘bzm – Arrivals Thread Group’
How to configure workload using ‘Arrivals Thread Group’?
- Add the Arrivals Thread Group in the test plan by following the above-described steps
- Provide the values for the below input fields:
- Target Rate (arrivals/minute)
- Ramp-Up Time (in minutes)
- Ramp-Up Step Count
- Hold Target Rate Time (in minutes)
- Time Unit
- Thread Iterations Limit
- Log Threads Status into File
- Concurrency Limit
What are the input fields of ‘Arrivals Thread Group’?
- Name: To provide Thread Group name. It may be your Test Case/Test Scenario name
- Comments: To provide comments.
- Action to be taken after a Sampler error: Actions taken in case of sampler error occurs, either because the sample itself failed or an assertion failed etc. The possible choices are:
- Continue – ignore the error and continue with the test
- Start Next Loop – ignore the error, start the next loop and continue with the test
- Stop Thread – current thread exits
- Stop Test – the entire test is stopped at the end of any current samples
- Stop Test Now – the entire test is stopped abruptly. Any current samplers are interrupted if possible.
- Target Rate (arrivals/min): Total number of iterations to be started in 1 minute. You can also provide Target Rate in seconds by selecting ‘seconds’ in the ‘Time Unit’ option given below the scenario chart.
- Ramp-up Time (min): Total ramp-up duration in minutes. You can also provide ramp-up duration in seconds by choosing ‘seconds’ in the ‘Time Unit’ option given below the scenario chart.
- Ramp-up Steps Count: Total number of steps in which a group of threads (users) will ramp up.
- Hold Target Rate Time (min): The steady-state when all the threads are active. This is also called a system monitoring window. If you want to monitor the system/application performance for 1 hour then the value for hold target rate time will be 60 minutes or 3600 seconds. The ramp-up time does not add to this time.
- Time Unit: To change the input time unit either in minutes or in seconds.
- Thread Iterations Limit: Maybe the purpose of this option is to control the loop count, but unfortunately it does not work so you may keep it blank.
- Log Thread Status into File: Provide the full path of the file along with the name where you want to save the log file. e.g. C:\PerfMatrix\Result\testLogFile.log
- Concurrency Limit: Provide the thread count to maintain the user concurrency.
Example
Considering the above-discussed scenario. A movie ticket app gets 1000 movie ticket bookings in an hour (16.6 = ~17/min). All the tickets are booked by a unique user and user concurrency will be 15.
