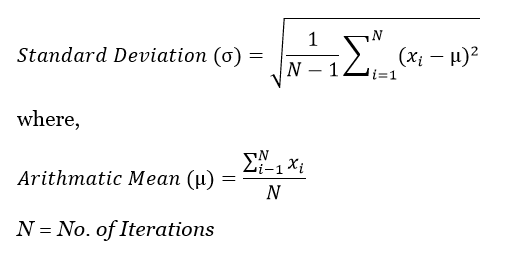
Many performance testers do not know the importance of Standard Deviation in performance testing and hence give less attention to it. Standard Deviation is a key metric in performance test result analysis which is related to the stability of the application. The calculation of Standard Deviation is a bit complex and the probability of making the mistake with large number data is high. Also, it is very difficult and time-consuming to calculate the standard deviation for a large number of datasets. That is why various analysis tools calculate Standard Deviation and give a summary so that you can make a decision on how the application will behave in real-time.
Standard Deviation seems very complex after looking at its formula and method of calculation. In the first part of this article, you come to know the importance of Standard Deviation in Performance Testing. In the later part, you will learn how to calculate the Standard Deviation of given figures. (That may be optional for a Performance Tester)
Definition:
The Standard Deviation is a measure of how response time is spread out around the Mean. Simply say, the smaller the Standard Deviation, the more consistent the response time.
Formula:

Importance of Standard Deviation in Performance Testing
Standard Deviation in your test tells whether the response time of a particular transaction is consistent throughout the test or not. The smaller the Standard Deviation, the more consistent the transaction response time and you will be more confident about a particular page/request. Delivering a consistent experience to the end user is just as important as delivering a fast and responsive experience. Let’s take an example:
| Transaction Name | RT (I1) | RT (I2) | RT (I3) | RT (I4) | RT (I5) | Avg | SD | 90th %ile |
| Login | 4 | 6 | 3 | 4 | 8 | 5 | 2 | 6 |
| Search | 3 | 2 | 15 | 1 | 4 | 5 | 5.7 | 4 |
| Logout | 5 | 5 | 6 | 4 | 5 | 5 | 0.7 | 5 |
where:
RT = Response Time
I = Iteration
Avg = Average Response Time
SD = Standard Deviation
In the above example:
- The averages for all the transactions are the same. You cannot say the test results are good on the basis of average response time because averages are considered useless in Performance testing.
- The 90th percentile of the “Search” transaction is better than the other two, but you can see I3 has 15 seconds response time. It is true we do consider percentile value as an important metric, but not alone. You also need to check how much response time is deviating.
- The “Logout” transaction has the lowest Standard Deviation (0.7). It shows response times are more consistent than the other two and it is true we can see very less deviation in “Logout” response time 5, 5, 6, 4, 5. Also, its 90th percentile is 5.
So, we got our best performer (Logout) and need to investigate the other two requests (Login and Search) for tuning purposes.
Calculation of Standard Deviation:
It is trivial to explain how Standard Deviation is calculated because as a performance tester, you will be looking for a tool that calculates quick and correct Standard Deviation and save your time. Still, if you want to know the magic behind Standard Deviation calculation, then refer to the below steps:
- Calculate the Mean (the simple average of the numbers)
- Subtract the Mean from each number and square the result
- Add up all the values then divide by N-1
- Take the square root of that. It’s your Standard Deviation
Illustration of Search Transaction response time:
Step 1:
Mean = (3 + 2 + 15 + 1 + 4)/5 = 5
Step 2:
(3-5)2 = 22 = 4;
(2-5)2 = 32 = 9;
(15-5)2 = 102 =100;
(1-5)2 = 42 =16;
(4-5)2 = 12 =1;
Step 3:
(4 + 9 + 100 + 16 + 1)/4 = 32.5
Step 4:
√32.5 = 5.7
You may be interested:
- Importance of 90th Percentile
- Understand the difference between Throughput, Bandwidth, Latency and Response Time

