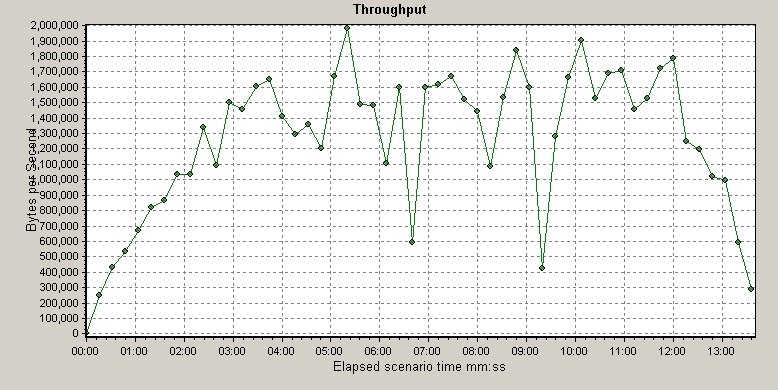
LoadRunner Throughput Graph Key Rules
There are some key rules for LoadRunner Throughput Graph which may help you to read and analyze the graph and conclude the result.
There are some key rules for LoadRunner Throughput Graph which may help you to read and analyze the graph and conclude the result.

Copying Runtime settings from one script to another is a simple export and import task in LoadRunner. The file is exported or imported in JSON format

I always consider Test Analysis as the most important and technical part in performance testing rather than scripting and execution. Performance test result analysis requires your actual expertise. During the analysis phase, you can determine… LoadRunner – Overlay, Correlate & Tile Graphs

Purpose: In LoadRunner, the error graph helps a performance tester to understand what the error came during the performance test. The error graph gives a detailed picture of what and when errors come. This graph… LoadRunner – Error Graph
What is ‘Transactions per second’? There is a major difference in Transactions per second and Hits per second. A single transaction can create multiple hits on the server. A transaction is nothing but a group… LoadRunner – Transactions per second (TPS) Graph
What is ‘Hits per second’ graph in LoadRunner? ‘Hits per second’ refers to the number of HTTP requests sent by the user(s) to the Web server in a second. In terms of performance testing, there… LoadRunner – Hits per second Graph