
What is ‘Transactions per second’?
There is a major difference in Transactions per second and Hits per second. A single transaction can create multiple hits on the server. A transaction is nothing but a group of requests in web test terminology. A transaction can have multiple requests and encapsulate requests into a group, e.g., a login operation, which involves 5 HTTP requests, can be grouped into a single transaction. When you compare the graph of such a scenario, there are five dots in the ‘Hits per second’ graph against one dot in the ‘Transactions per second’ graph.
Purpose:
The main purpose of the Transactions per second (TPS) graph during the test is to keep an eye on the transaction rate. If you have a TPS SLA, then you can control the TPS rate by setting think time and pacing in the test script.
TPS exceeding SLA indicates that the test script is making more hits on the server and resulting in extra burden; on the other hand, if TPS SLA is unachievable, then the test cannot be considered a pass in performance testing. Therefore, make sure the test script has the proper pacing and think time calculation. You can calculate pacing using the link below
The transactions per second graph also shows the passed and failed transactions. Using the ‘Total transactions per second’ graph you can get the total number of transactions that passed, the total number of transactions that failed and the total number of transactions that were stopped, for each second of the test run whereas the ‘Transactions per second‘ graph displays passed, failed and stopped count of the individual transaction for each second of the test run.
LoadRunner Transaction Graphs:


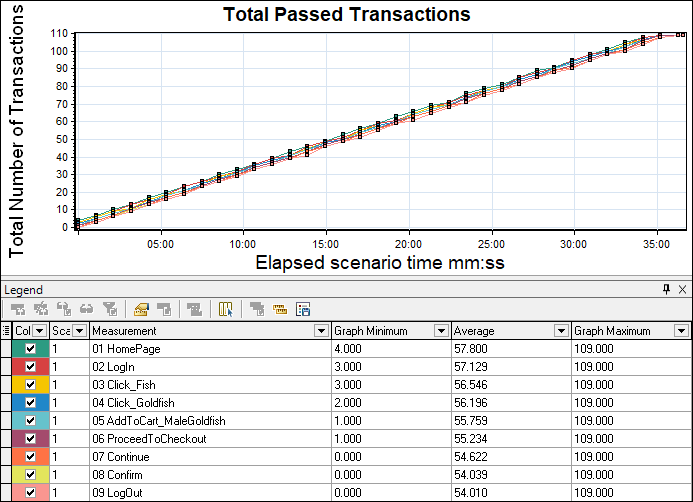
Graph Axes Representation:
X-axis: This graph has elapsed time on the X-axis. The elapsed time may be relative time or actual time as per the graph’s setting. This also shows the complete duration of your test.
Y-axis: Number of transactions in the test
How to read:
This graph is very helpful for the live monitoring of the test. The graph line shows the achieved TPS rate to compare with your test SLA. The summary table shows the count of passed, failed, and stopped transactions. In case TPS is unachievable, then:
- Check response time graph: If response time is SLA breached (or noted higher than expected) and you have given constant pacing or think time, then this will impact the TPS rate. To resolve such a problem, you can use dynamic pacing logic.
- Re-calculate Pacing and Think time: If no issue with response time, then you need to re-calculate pacing and think time. Use dynamic pacing for a more accurate result.
- Increase number of users: Already, you have given real-time pacing/think time, and response time also meets your requirement. Still, if TPS is not matching, then you can increase the number of users regardless of No. of users are not given in your SLA.
Merge with other graphs:
- With Running Vusers graph: You can merge the transactions per second graph with the Running Vuser graph to understand if any downfall in the TPS rate is due to the stop/exit of the user.
- With Response Time: The average transaction response time graph can be correlated with the Transactions per second graph to see the effect of the number of transactions upon the transaction performance time. An increase in response time impacts transactions per second inversely. Due to high response time (with constant pacing and think time setting), you will get a decline in transactions per second.
- With Throughput: Ideally, the transactions per second graph should be followed by the throughput graph. If this is not the case, then you need to check the error or network latency graph.
You may be interested:
- Performance Testing Tutorial
- Performance Engineering Tutorial
- Apache JMeter Tutorial
- Neotys NeoLoad Tutorial