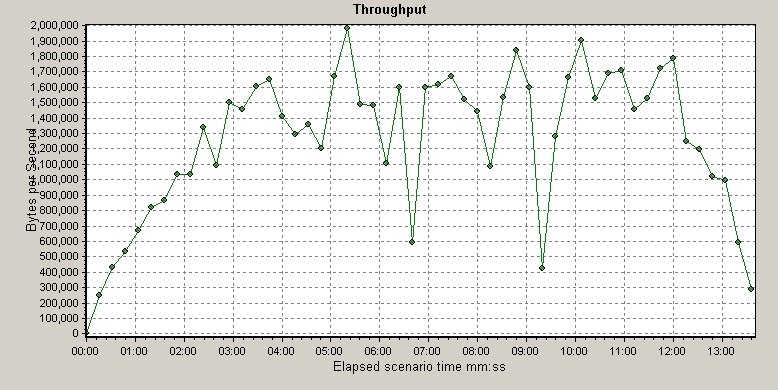
What does a Throughput graph represent in LoadRunner?
In LoadRunner, a throughput graph provides information about the amount of data (in Bytes or MB) that a Vuser received from the server at any given time. This graph helps to analyse the performance of the application in terms of server throughput.
What are the key rules to read LoadRunner Throughput Graph?
There are some key rules for LoadRunner Throughput Graph that may help you to read and analyze the graph and conclude the result:
Rule 1:
If the throughput graph heads upward as time progresses and the number of Vusers increases then this indicates that the server processes the request without any issue as well as the network bandwidth is sufficient.
Rule 2:
If the throughput graph becomes relatively flat as time progresses and the number of Vusers increases then this indicates that there could be the possibility of low network bandwidth; no issue with server performance. The low network bandwidth limits the amount of data that is transferred between client and server.
Rule 3:
If a sudden drop appears in the throughput graph during ramp-up or steady-state then this indicates that network bandwidth is sufficient, but an issue with the server side. Start your investigation at the server end to find out what is impacting the server performance. You may need to take the thread dump and heap dump to analyse the behaviour of Memory.
You may be interested:
- Performance Testing Tutorial
- Performance Engineering Tutorial
- Apache JMeter Tutorial
- Neotys NeoLoad Tutorial

