
AWR or Automated Workload Repository report provides detailed information about the database to conduct the analysis of the performance of Oracle Database. This article will help you to get knowledge on important AWR report sections and how to read and conclude the DB performance.
Once you generate the report by following the steps provided in the article AWR Report then copy the HTML file to your local. Now, open the AWR report in the browser and start the analysis. The AWR report has the following sections:
Database & Snapshot Details
This is the first and top section of the report. This section contains the information about database, its configuration and snapshots. The snapshot section provides information about the snapshot taken. The Begin Snap shows the time of the first snap and the End Snap shows the time of the last snap. The difference between them is as ‘Elapsed’. Here you can see a new term ‘DB Time’ which is the sum of CPU time and non-ideal wait time
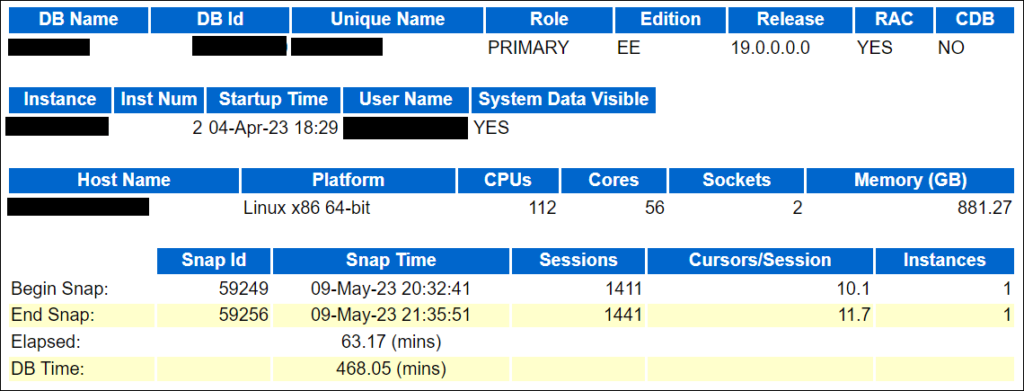
DB Time= CPU Time + Non-Ideal wait time //session time spent in the database
You can find, DB Time is very large as compared to Elapse Time, which is not a concern. Check if you have taken a report for the time having performance problems. If yes fine, otherwise take a report for performance problem time.
Load Profile
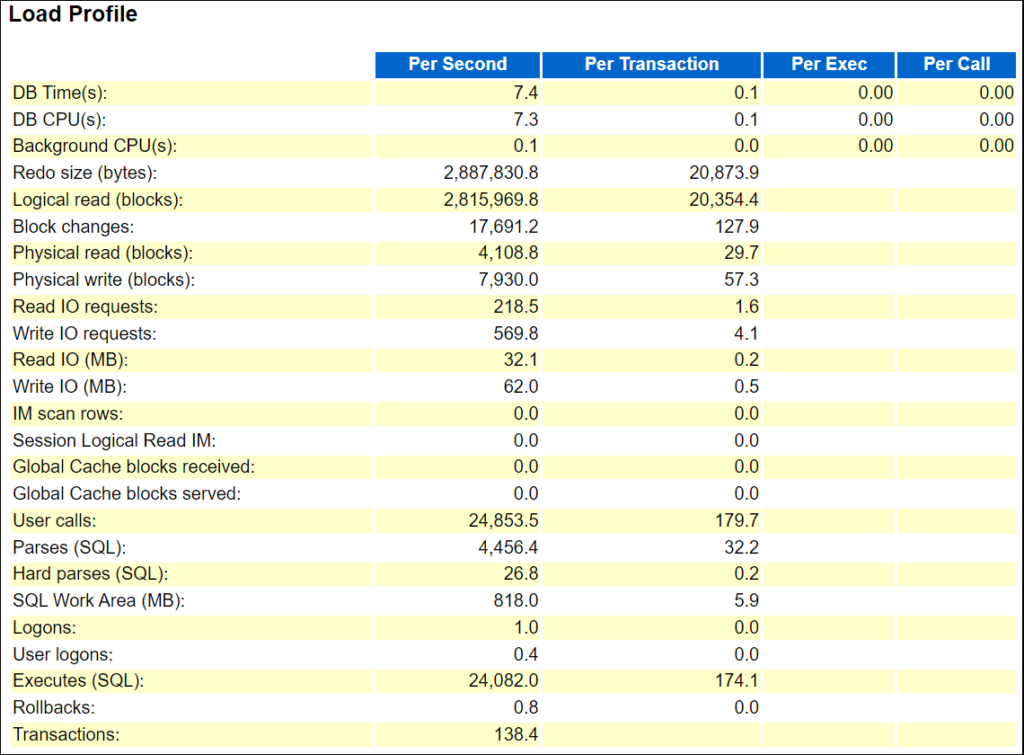
Here are a few important stats for a DBA to look into. The first is “DB CPU(s)” per second. Before that let’s understand how DB CPUs work.
Suppose you have 12 cores in the system. So, per wall clock second, you have 12 seconds to work on the CPU. So, if “DB CPU(s)” per second in this report > cores in (Host Configuration (#2)). It means the environment is CPU bound and either needs more CPUs or needs to further check if is this happening all the time or just for a fraction of time. As per my experience, there are very few cases, when the system is CPU bound.
In this case, the machine has 12 cores and DB CPU(s) per second is 6.8. So, this is not a CPU-bound case.
The next stat to look at is Parses and Hard parses. If the ratio of hard parse to parse is high, this means Database is performing more hard parse. So, needs to look at parameters like cursor_sharing and application level for bind variables etc.
Important Points:
- Give physical reads, physical writes, hard parse-to-parse ratio and executes to transaction ratio the greatest consideration.
- The ratio of hard parses to parses tells you how often SQL is being fully parsed. Full parsing of SQL statements has a negative effect on performance.
- High hard parse ratios (>2% – 3%) indicate probable bind variable issues or maybe versioning problems.
- Rows per sort can also be reviewed here to see if large sorts are occurring.
- This section can help in the load testing for application releases. You can compare this section for the baseline and the high load situation.
Instance Efficiency Percentages (Target 100%)
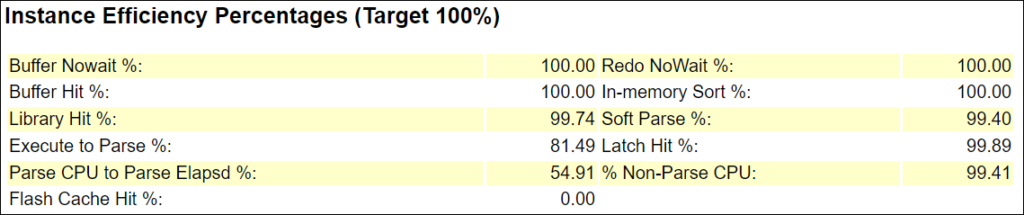
In these statistics, you have to look at “% Non-Parse CPU”. If this value is near 100% means most of the CPU resources are used in operations other than parsing, which is good for database health.
Important Point:
- Always minimize the number of Hard parses. This reduction yields the benefits of minimizing CPU overhead spent performing costly parse work.
Top 10 Foreground Events by Total Wait Time: This is another most important stat to consider while looking at AWR Report for any database performance-related issue. This has a list of the top 10 foreground wait events.
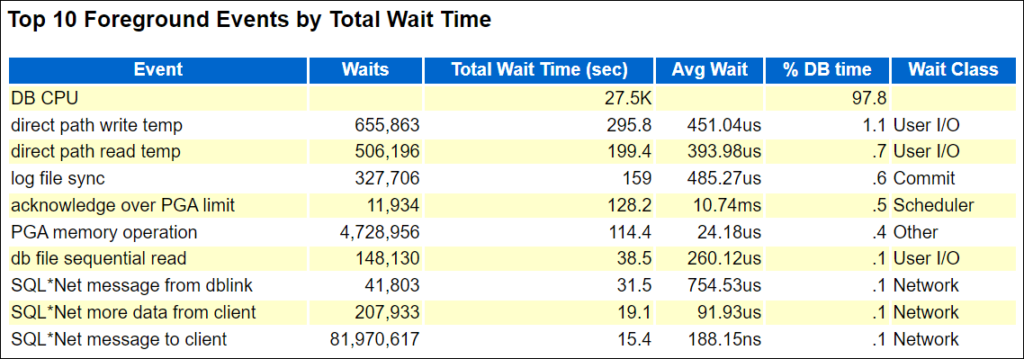
Check for the ‘Wait Class’ here first. It would be okay if the “Wait Class” value is User I/O, System I/O, Others, etc., but if the value is “Concurrency,” there might be some major issues.
After that, take a look at the value for “Total Wait Time (sec),” which indicates how many times the database was waiting for the particular event. Check the same event’s “Avg Wait” as well. You can ignore this if the “Total Wait Time (sec)” is high but the “Avg Wait” is low. If both are high or the “Avg Wait” is excessive, additional investigation is required.
In the above screenshot, most of the resources are taken by DB CPU = 97.8% DB time. Taking resources by DB CUP is a normal situation.
The same rule is applicable for the ‘Wait Classes by Total Wait Time’.
Host CPU and Instance CPU
In these sections, give attention to the value of “%Idle” in the ‘Host CPU’ section and ‘%Total CPU’ in the ‘Instance CPU’ section.
If the “%Idle” is low and “%Total CPU” is high then the instance could have a bottleneck in CPU. Otherwise, the high DB CPU usage just means that the database is spending a lot of time in CPU (processing) compared to I/O and other events.
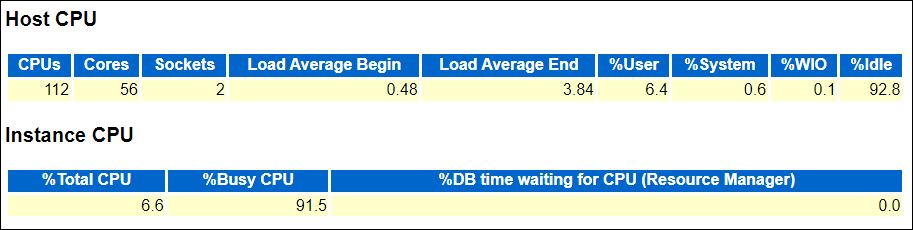
If you see in our case %idle is high at 92.8% AND %Total CPU is just 6.6 so the CPU is not a bottleneck in this example.
IO Profile, Memory Statistics, Database Resource Limits, Cache Sizes and Shared Pool Statistics sections are self-explanatory.
Time Model Statistics
This is a detailed explanation of system resource consumption. The statistics are ordered by % of DB Time.
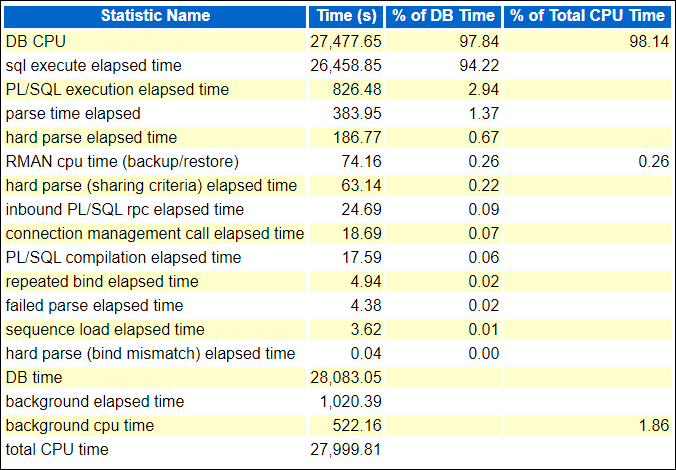
The ‘sql execute elapsed time’ is taking 94.22% of DB time, which includes the sub-parts like parse time elapsed, hard parse elapsed time etc. So, if you notice that the ‘hard parse elapsed time’ value is significantly higher in percent, look into it more, and so on.
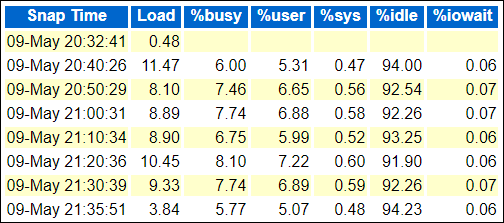
Operating System Statistics – Detail
There is information about the load and workload of your operating system in this section. The screen image below shows that the system is more than 91% idle at the time of the report, so there isn’t any resource overload at the system level. However, if you have found a very high %busy, %user or %sys and in fact, this is going to result in a low %Idle then it will be necessary to carry out an investigation.
SQL ordered by Elapsed Time
As explained by the name itself, this lists SQL queries ordered by Elapsed Time into reported time intervals. In the report, look for a query that has low executions and high Elapsed time per Exec (s) and this query could be a candidate for troubleshooting or optimizations. In the below report, you can see the first and second queries have maximum Elapsed time but significantly low execution; especially the second one. Therefore, you need to look into this.
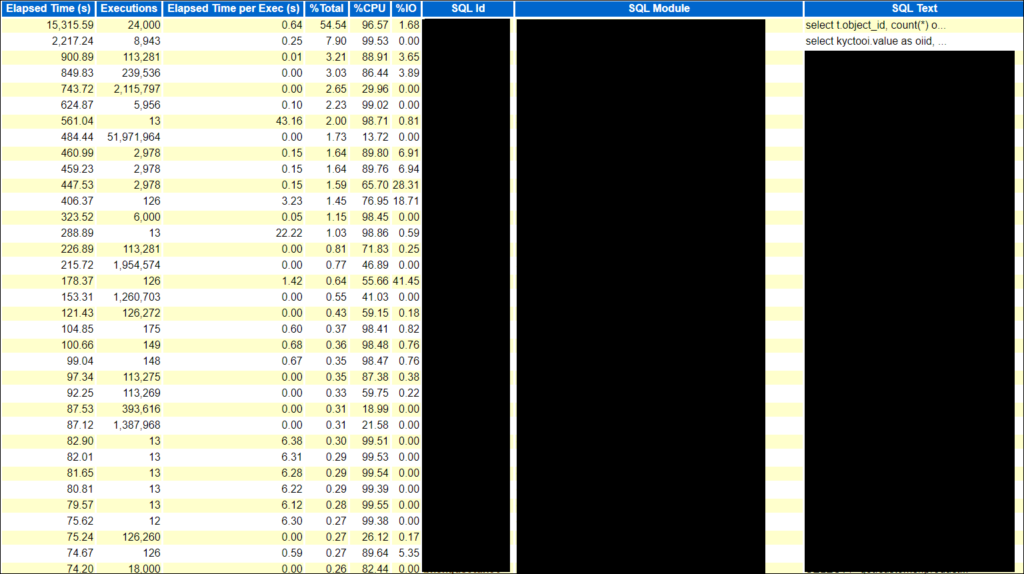
Another important point is in case the value of Executions is 0 for some queries then it doesn’t mean the query is not executed. This might be the case when the query was still executing and you took the AWR report. That’s why query completion was not covered in Report.
Important Points:
- The Elapsed time can indicate if a SQL is multithreaded (either Parallel DML/SQL or multiple workers). In this case, the elapsed time will be multiple times the AWR duration. The elapsed time for multithreaded SQL will be the total elapsed time for all workers or parallel slaves.
- This section can often contain the PL/SQL call that contains SQLs. So in this case some procedures call the SQL which can be identified through the same SQL Module value.
SQL Ordered by CPU Time
In this section, SQL queries are listed on the basis of CPU time taken by the query i.e. queries causing a high load on the system. The top few queries could be the candidate query for the optimization.
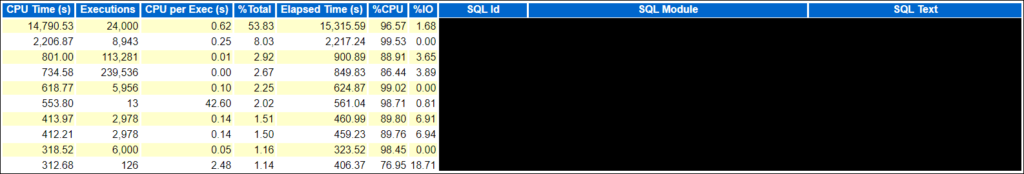
From the above stat, look for queries using the highest CPU Time (s). If a query shows Executions value as 0 then this doesn’t mean the query is not executing. It might be the same case as in SQL queries ordered by Elapsed time. The SQL query is still executing and you have taken the snapshot.
However, there are so many other stats in AWR Report that a DBA needs to consider. In this article, only important sections are covered. These are the most commonly used stats for any performance-related information.
Reference Document: Link
You may be interested:
- Performance Engineering Tutorial
- Heap Dump – Overview
- Thread Dump – Overview
- Garbage Collection – Overview