
There are several thread dump analysis tools are available to carry out the investigation on Threads and find out the root cause of the issue. Out of those, I found 2 thread dump analysers which are really good.
Thread Dump Analysis Tools:
- fastThread: This is an online thread dump analyzer. It has a simple and easy dashboard view. fastThread helps to provide a detailed view of blocked, runnable, timed waiting, waiting and repeating stack traces. fastThread parses and analyzes thread dumps written in any language that runs on the JVM. Another good thing is that you just need to upload the application thread dump files & review the reports instantly in one click.
- jstack.review: Another online thread dump analyzer. The additional feature of this tool is that if you face a problem in uploading the thread dump file, you can paste the thread dump file content in the given thread dump section and analyse it. It also gives the option to compare and analyse the dumps.
To understand the thread dump analysis practically, we will use the ‘fastThread’ tool. We will see how to identify the deadlocks, blocked threads, waiting threads etc. with the help of the fastThread tool. fastThread tool provides detailed information about each thread along with their states. It analyses the thread dump file and helps to find out the deadlock or any other problematic issue.
How to analyse Thread Dump using fastThread?
Step 1. Browser http://fastthread.io

Step 2. Browse the thread dump file (.zip, .gz, .tdump format) using “Choose File” button.

Step 3. Click “Analyze”. You can see the file ‘Uploading’ is in progress as illustrated in Figure 03.

Step 04: After clicking “Analyze”, fastThread takes a few seconds to scan and analyse the dump and prepare the dashboard.

Step 05: On the completion of step 04, fastThread shows the result of the analysed thread dump. You can see multiple tabs in the left pane and the detailed view of each tab in the right pane of the dashboard. The result contains a Thread count Summary, Identical stack trace, most used methods, CPU Threads, GC Threads etc. that provide you with detailed information about each thread and identified issues.
Thread Dump Analysis:
There are different possible scenarios which may occur in the production as well as the test environment. In this section, we will discuss some common and important scenarios which will give you knowledge of how to identify the issue and conclude the investigation. We will also get some tips at the end of each scenario.
For a better understanding purpose, we will divide the analysis into 3 scenarios which are:
- Normal Scenario
- Blocked Thread Scenario
- Deadlock Scenario
Normal Scenario
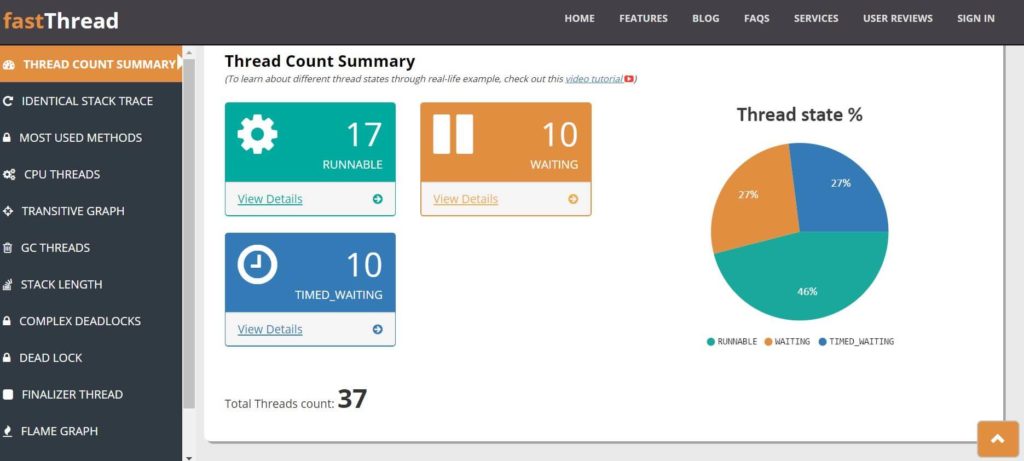
So, let’s start with a Normal scenario where all the threads are performing well without any issues. Refer to the Thread Count Summary on the fastThread dashboard:

None of the thread is blocked due to a resource crunch. 17 threads are running. 10 threads locked the resources and waiting for their chance to execute or response from other thread execution. Remaining 10 threads are either parked or sleep or made to wait using respective methods. The same information is available in percentage in the pie chart (shown in the right).
Click “View Details” to get more information about each thread.

As stated above, there is no blocked thread hence transitive graph is not available
Deadlock Identification: Refer to the Dead Lock tab. We found that fastThread did not identify any deadlock. See below:

Conclusion:
All the threads are working fine without having any issues or crunch of the resources. Hence no blocked thread is found, also no deadlock was reported.
Tip:
In case you do not want to use the fastThread and analyse the dump manually then follow the below steps:
Step 1. Open the thread dump file in Notepad++.
Step 2. Look at the first thread and get the resource ID locked by it. Example: Java2D Disposer thread locked the resource 0x00000000f03eb540. See below:
"Java2D Disposer" #17 daemon prio=10 os_prio=2 tid=0x0000000017816000 nid=0x30dc in Object.wait() [0x000000001946f000]
   java.lang.Thread.State: WAITING (on object monitor)
        at java.lang.Object.wait(Native Method)
        at java.lang.ref.ReferenceQueue.remove(ReferenceQueue.java:143)
        - locked <0x00000000f03eb540> (a java.lang.ref.ReferenceQueue$Lock)
        at java.lang.ref.ReferenceQueue.remove(ReferenceQueue.java:164)
        at sun.java2d.Disposer.run(Disposer.java:148)
        at java.lang.Thread.run(Thread.java:748)

Locked ownable synchronizers:
- None
Step 3. Select that resource ID (0x00000000f03eb540) and then search in the thread dump file. If only 1 resource ID is present then it shows that only 1 thread locked the given resource.
Step 4. In case you found more than one occurrence in the thread dump file then check whether some other threads are waiting for the same resource. This situation causes the thread (s) blocked. We will discuss such a situation in the next scenario.
Blocked Thread Scenario
To continue the thread dump analysis, now we will move to the next part which will cover the analysis of blocked threads. The meaning of blocked thread is that a thread locks a resource for a long time and restricts other threads to use that particular resource, hence the restricted threads are moved into the Blocked state and named as Blocked Threads. Let’s try to understand with an example. Refer to the below fastThread dashboard which shows the status of 3 threads.
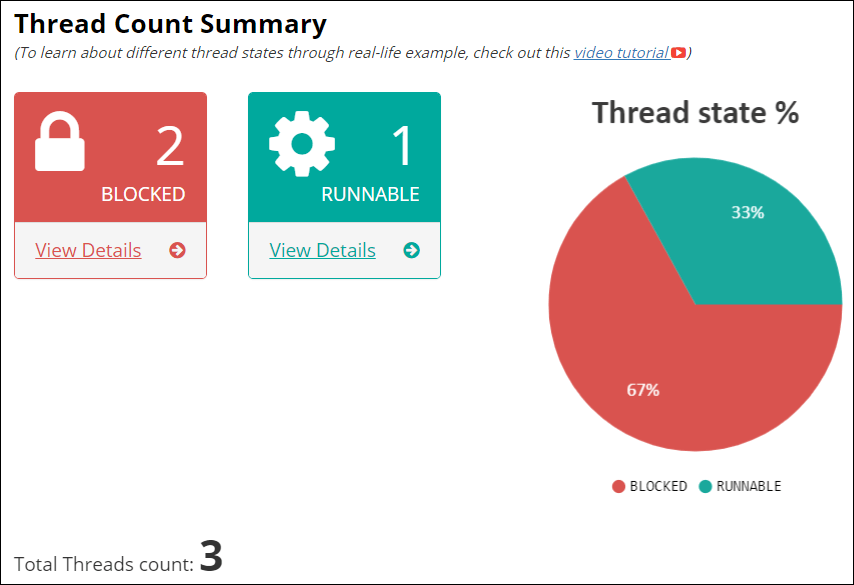
Thread Count Summary shows that out of 3, two threads are in the blocked state whereas 1 thread is in the runnable state which needs an investigation.
Now, refer to the transitive graph and read the message:
“com.nbp.theplatform.threaddump.ThreadBlockedState is blocking 2 threads“
We can see pool-1-thread-1 is blocking pool-1-thread-2 and pool-1-thread-3.
When we navigate to the Identical Stack Trace of the Runnable thread then we can see more information about the thread and locked resources. thread-2 and thread-3 have a dependency on thread-1 locked resources.


Deadlock Identification: Refer to the Dead Lock tab. We found that fastThread did not identify any deadlock. See below:
Conclusion:
It has been identified that thread-2 and thread-3 are waiting for <0x0000000750a000b0> which is locked by thread-1 and hence it leads the blocking of thread-2 and thread-3.
Tip:
In case you do not want to use the fastThread and analyse the dump manually then follow the below steps:
Step 1. Open the thread dump file in Notepad++.
Step 2. Look at the first thread and get the resource ID locked by it. Example: Java2D Disposer thread locked resource 0x00000000f03eb540. See below:
"Java2D Disposer" #17 daemon prio=10 os_prio=2 tid=0x0000000017816000 nid=0x30dc in Object.wait() [0x000000001946f000]
   java.lang.Thread.State: WAITING (on object monitor)
        at java.lang.Object.wait(Native Method)
        at java.lang.ref.ReferenceQueue.remove(ReferenceQueue.java:143)
        - locked <0x00000000f03eb540> (a java.lang.ref.ReferenceQueue$Lock)
        at java.lang.ref.ReferenceQueue.remove(ReferenceQueue.java:164)
        at sun.java2d.Disposer.run(Disposer.java:148)
        at java.lang.Thread.run(Thread.java:748)

   Locked ownable synchronizers:

        - None
Step 3. Select that resource ID (0x00000000f03eb540) and then search in the thread dump file. If only 1 resource ID is present then it shows that only 1 thread locked the given resource.
Step 4. In case more that one occurrence you found in the thread dump file then check whether some other threads are waiting for the same resource and if yes, then what are their state? If those threads having the state as Blocked then you can carry out further investigation. Another situation of the Blocked thread is Deadlock. We will discuss it in the next scenario.
Deadlock Scenario
Deadlock is a situation when the locked resources are required by some other threads who locked some resources which are needed by other threads. Such a cyclic condition restrict to complete the execution of any of the threads, resulting in none of the thread completes its execution and system is halted. Refer to the below fastThread dashboard which shows the status of 3 threads.

Now, look at “Complex DeadLocks” section:

Conclusion:
A circular complex deadlock is created by all three threads. Thread-1 locked <0x00000007d58f5e48> and waiting for <0x00000007d58f5e60> which is locked by Thread-2 and it is waiting for <0x00000007d58f5e78> which is locked by Thread-3 and waiting for <0x00000007d58f5e48> which is again locked by Thread-1. Hence it creates a deadlock situation and stops the system.
Tip:
In case you do not want to use the fastThread and analyse the dump manually then follow the below steps:
Step 1. Open the thread dump file in Notepad++.
Step 2. Look at the first thread and get the resource ID locked by the thread.
Step 3. Select that resource ID and then search in the thread dump file. If only 1 resource ID is present in the file then it shows that only 1 thread locked the given resource.
4. In case more than one occurrence you found in the thread dump file then check whether some other threads are waiting for the same resource and are they in the Blocked state? If yes, then pick the locked resource ID of the Blocked Thread and search in the thread dump file and repeat step 3 and 4. If the resources are interdependently locked by the threads then it shows that the threads are in deadlock and needs an investigation to prevent such circumstances in the future.
You may be interested: