Introduction:
fastThread is a fine thread dump analyzer, having all the basic features required to analyse a simple as well as a complex thread dump. It is an online open-source tool and can be accessed via URL. Basically, fastThread comes under the analysis tool category and is majorly used for performance engineering to find out the exact root cause of the issue, produced by Java Thread. Software developers or performance engineers use this tool to identify the issue in the thread processing and resolve them (if found). The possible issues have already been discussed in the Thread Dump Analysis topics.
Pre-requisite:
Thread Dump File (How to generate thread dump?)
How to analyse thread dump using the fastThread tool?
Below are the steps to operate the fastThread tool and carry out the analysis of the thread dump.
1. Launch fastThread using URL: http://fastthread.io/

2. Browse and Upload the Thread Dump file. You can upload a maximum of 5 thread dump files at a time. fastThread supports .zip, .gz, .tdump, .txt etc. file formats. It is a good practice to upload a .zip or .gz file to avoid file size issues.

3. Click the ‘Analyze’ button. fastThread starts analyzing the thread dump and shows the analysis report within a few moments.

4. fastThread displays the thread dump analysis report on the dashboard.
5. The first section in the dashboard has the thread dump summary with the heading ‘Thread Dump – Intelligence Report’. This section has the thread dump file name, timestamp (when the thread dump was taken) and JVM version. It also gives options to download or share the report with others. Another importance of this section is you can confirm whether threads have any issues or not. The smiley face shows ‘no issue’ in the thread dump and the application was working fine whereas a sad face indicates ‘the existence of the issue’ which needs to be investigated with further analysis. Refer to Figure 05.

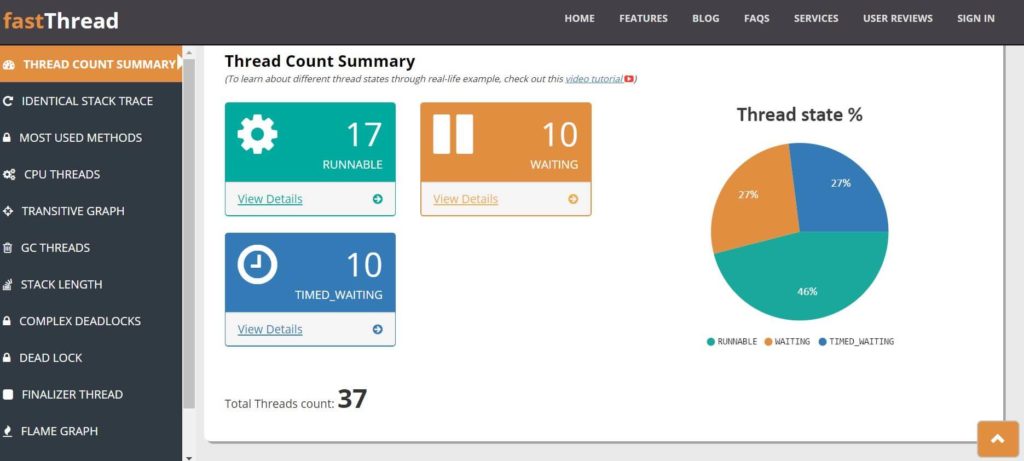
6. ‘Thread Count Summary’ tab is the starting point of the analysis. This tab has the total thread count executed under a process. Along with thread count, you can also get the thread state like Runnable, Waiting, Timed_Waiting, and Blocked (refer to post to get more understanding on Thread State). You can click on the ‘View Details’ link given under each thread state to get more details on the threads.

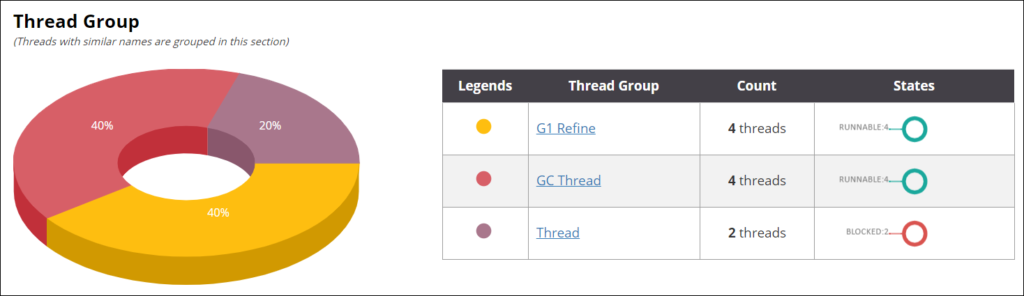
7. The next section is ‘Thread Group’. This section shows groups of threads with a similar name in a pie chart view. Also, you can refer to the table having the thread group name, thread count and their states.
8. The next section shows information about Daemon and non-daemon threads. Click the “View Details” link to get more information related to the thread.
Daemon Thread: Daemon thread is a low-priority thread and runs in the background to perform tasks such as garbage collection etc. A Daemon thread has a number of non-daemon threads and it dies when all the associated non-daemon thread completed their execution or died.
Non-Daemon Thread: It is a normal thread or also called “User Thread”.

9. If there is any deadlock exists then fastThread gives a clear notification in the Dead Lock section. Referring to Figure 08, Thread-0 and Thread-1 formed a deadlock. fastThread also shows the ‘waiting to lock’ and ‘locked’ resources for each thread which helps to identify the exact root cause.

10. In the next section, you can see get the thread count having the same stack trace. The individual bar shows the number of threads with the identical stack. You can also refer to the table beneath this chart to get more details on the stack trace.
Stack Trace is helpful when there is a performance bottleneck in the application then most of the threads start to accumulate on the problematic bottleneck area and form the same stack trace. Thus whenever a significant number of threads exhibit identical/repetitive stack trace then look into the stack trace and do the further investigation.

11. The list of the frequently used method is available in the next section i.e. Most used methods. In case you see, several threads in a thread dump end up working on one single method then it might be of concern. Most of the time, if there is a problem like a poorly responding data source, un-relinquished lock, infinite looping threads etc. then a significant number of threads end up in one single method. That particular method has to be analyzed in detail.

12. The next section belongs to CPU consumption. This section shows the most CPU-consuming method along with the thread count executing those methods. In reality, JVM marks several threads as ‘Runnable’ although they are not running and just waiting for resources. Such waiting threads do not cause high CPU utilization. Therefore you should know first which are the actual ‘Runnable’ thread and continue the investigation on the high CPU issue.

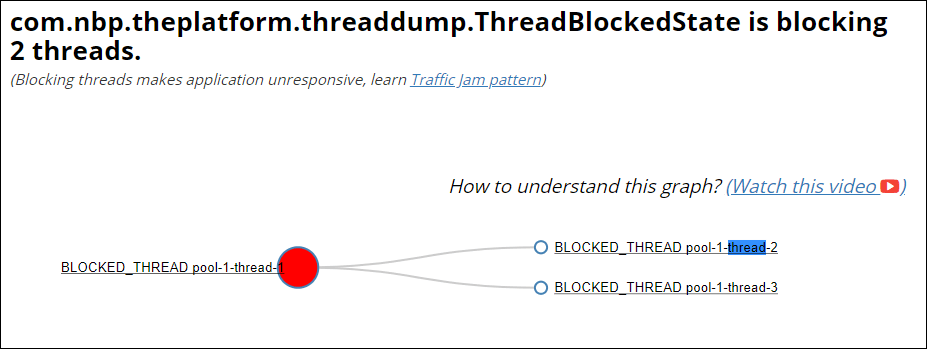
13. The Blocked thread can be identified by a Transitive Graph. Refer to Figure 13, you can understand how pool-1-thread-1 blocked the pool-1-thread-2 and pool-1-thread-3 threads. The blocked threads make the application unresponsive, so proper diagnosis should be carried out for root cause analysis.
14. The GC Threads section provides how many GC Threads were running at the time of the dump. The count of GC Thread depends on the type of GC and its default configuration. But the generation of extra GC threads impacts the system performance. So, the GC thread count should be carefully configured. The ‘View Details’ option provides full details of the GC thread along with the GC type.

15. Thread’s stack stores methods, primitive data types, variables, object pointers, and return values. All of these consume memory. If the thread’s stack sizes grow beyond the allocated memory limit then StackOverflowError is thrown. The Thread Stack Length section provides the length of the stack and thread count. The good part is that fastThread concludes whether the stack trace length appears normal or not.

16. The importance of Finalizer Thread in the GC can be ignored. Because after the execution of finalize() method, the object becomes eligible for Garbage Collection. The poor implementation of finalize() method can block the Finalizer thread which may have a severe detrimental cascading effect on the JVM.

17. Flame Graph provides a single view of all the thread stack traces. You can click the method in the flame graph and validate the thread stack trace.

18. Bottom-up Call Stack Tree consolidates all the threads stack trace into one single tree and gives you one single view. It makes the thread dumps navigation much simpler and easier.

Conclusion:
fastThread is a very useful online tool to analyse the thread dump and shows a detailed picture of each thread. With a single click, you can find out the existing issue and highlight to the client or development team. I would say all the performance testers or engineers can enhance their knowledge about Thread Dump and its analysis using the fastThread tool.
You may be interested: