
Basic Server Monitoring Counters
A typical e-business application’s server has some basic monitoring counters to check the performance of the app server, web server, and database server.
A typical e-business application’s server has some basic monitoring counters to check the performance of the app server, web server, and database server.
This is one of the basic graphs and frequently use to debug the performance bottleneck. The error graph provides details about the type of errors and the time when they occurred. Error graphs could be… Error Graph
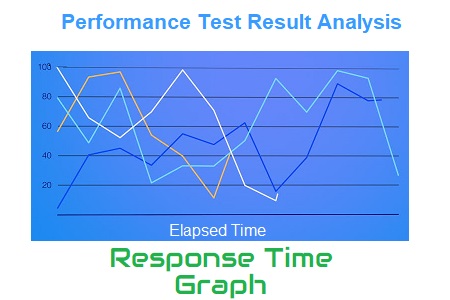
Response time graph gives a clear picture of overall time including requesting a page, processing the data and getting the response back to the client. As per PTLC (Performance Test Life Cycle), the Response time… Response Time Graph

Moving to the next level named as Intermediate level of performance test result analysis; you will learn how to read the different types of graphs. In the previous post, you got a high-level knowledge of… Performance Test Result Analysis – Intermediate

The primary goal of any performance testing is to provide a clear status on application performance and to identify performance issues (if any). Performance Test Result Analysis is crucial because a wrong prediction or a… Performance Test Result Analysis – Basic
