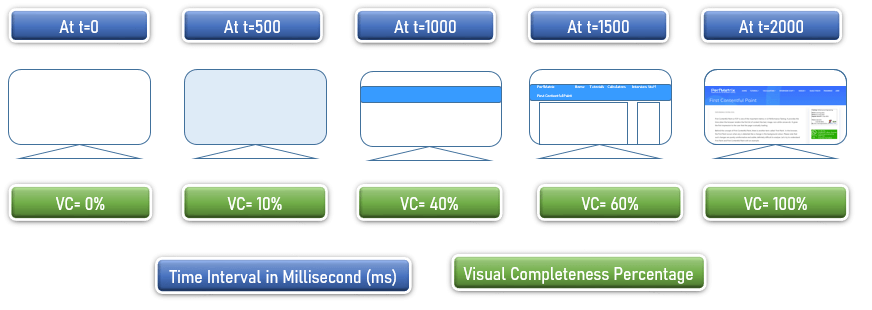
Speed Index (SI) is a UI Performance Testing metric that calculates how quickly the content of the webpage is visually displayed to the end-users. Actually, the speed index is not a time-based unit. It is a score that represents the content loading speed of a web page. The lesser is the value of SI, the better is the performance of that website.
How to calculate Speed Index?
The calculation of the speed index is pretty simple but it depends on the UI tool what time interval is considered to capture the visual frames. The UI tool calculates what percent of the page is visually completed at a fixed time interval until the page is visually completed.
Let’s try to understand Speed Index calculation with an example. Refer to the below figure that shows 5 frames of a website. The UI tool captures the loading screen of the website at a fixed interval (i.e. 500 ms) and calculates the percentage of visual completeness at that moment by some internal logic.

The formula of the speed index is

Now, put the values in the above formula:
500 * (1-(0/100)) = 500
500 * (1-(10/100)) = 450
500 * (1-(40/100)) = 300
500 * (1-(60/100)) = 200
500 * (1-(100/100)) = 0
Speed Index = 500 + 450 + 300 + 200 + 0
Speed Index = 1450
What is the ideal value of SI?
As described above, UI tools take different time interval frames to calculate the SI. Hence the value range is also different. Speed Index standard as per Google Lighthouse is:
| Speed Index (in milliseconds) | Considered As | Colour Coding |
|---|---|---|
| 0 to 3400 | Fast | Green |
| 3400 to 5800 | Moderate | Orange |
| Over 5800 | Slow | Red |
Some tools consider less than 1000 as a good SI score. So, again it depends on the approach of the calculation.
How to improve Speed Index score?
SI score can be improved by applying the following solutions:
- Optimize JavaScript and reduce the execution time
- Remove unused JavaScript
- Use lazy loading image
- Use progressive image logic
- Create Cache Hierarchy
- Optimize Images and Font
Can SI value be False?
Yes, consider there are two websites with the following visual completeness values:
| Time Interval (in ms) | VC of Website A | VC of Website B |
|---|---|---|
| 0 | 0% | 0% |
| 500 | 10% | 5% |
| 1000 | 30% | 10% |
| 1500 | 60% | 90% |
| 2000 | 100% | 100% |
| SI Score | 1500 | 1475 |
Since the full content of both the websites is loaded at the same time (i.e. at t=2000ms) and visually ready for the users so which website is faster than the other one?
The SI score of Website A is 1500 and Website B is 1475. Perhaps you would say Website B is faster than Website A on the basis of SI score but this is not completely true. Because the user will feel Website A is faster due to its gradual progressive nature whereas Website B will load most of the content suddenly at the last moment.
SI is always considered a subjective and supportive metric instead of a conclusive metric. Only SI metric is not enough to tell whether a website is slow or fast. Along with the Speed Index, you also need to consider other UI Performance metrics like First Contentful Paint, Largest Contentful Paint etc.
You may be interested:

