In LoadRunner, logs are the automatically generated and time-stamped data of events related to transactions, errors, parameter value, Vuser requests and responses sent by the server. The log settings are available in the ‘Runtime settings’ of VuGen and Controller. The logs are very useful:
- For debugging the script
- To correlate the dynamic value
- To get the output message
Refer to the below screenshot which shows the log setting in the runtime settings window. By default standard log is enabled which can be changed as per the requirement.
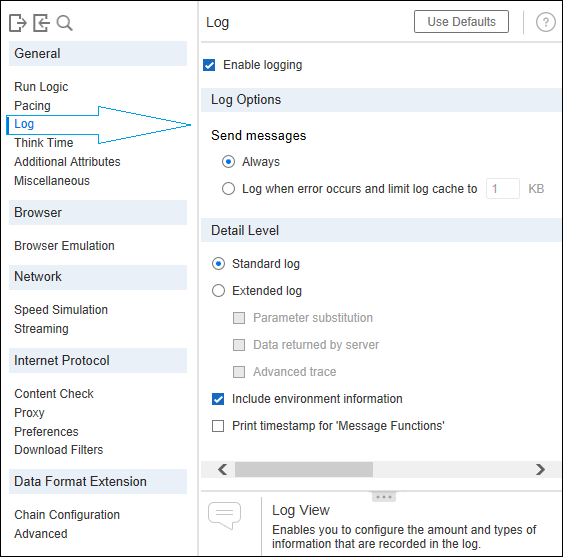
‘Log’ settings of LoadRunner:
Under the General category of LoadRunner runtime settings, the 3rd tab named ‘Log’ helps to enable or disable the LoadRunner log. LoadRunner has an option to capture the logs at different levels like simple as well as advanced trace log. LoadRunner has the following settings available for Logs:
1. Enable Logging:
This setting instructs the VuGen to generate the logs and display them in the output window.

Once you uncheck the ‘Enable logging’ option, the remaining options in the tabs will be disabled.
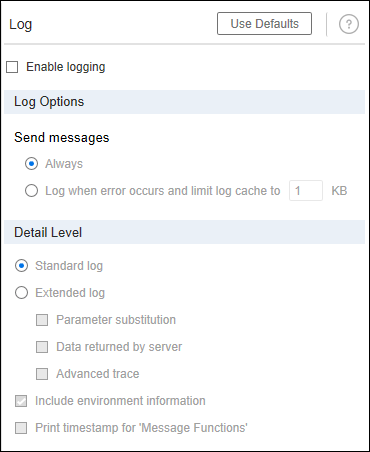
Note: The output message always displays in the output window, no matter whether ‘Enable logging’ is checked or unchecked.

2. Log Options:
It specifies when to capture the log. ‘Log options’ have two 2 choices either you can select ‘Always’ or ‘Log when error occurs…’.
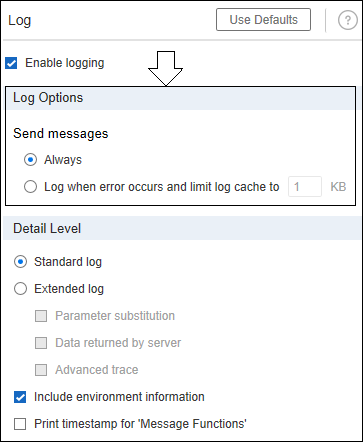
- Always: This option captures all the messages in the log file and generates a large amount of logs with a bulky log file. Ideally, this option is used only for script debugging purposes.

- Log when error occurs and limit log cache to XX KB: This setting captures the log only when any error appeared during the test. LoadRunner records only faulty events in the log file which is helpful in the bottleneck identification during result analysis. This option creates a smaller log file than the first option i.e. Always. Another part of this setting is controlling the log cache. You can specify the log cache size to improve the performance of the LoadRunner. If the log exceeds the cache size, older messages are overwritten. This setting can be used when there is a doubt of failure of the application during the test and you want to capture the error messages for analysis.

3. Detail Level:
‘Detail Level’ specifies what type of logs need to be captured. There are 2 major types of logs which are standard and extended logs. The extended log has three sub-types which are Parameter Substitution, Data return by server, Advance trace.
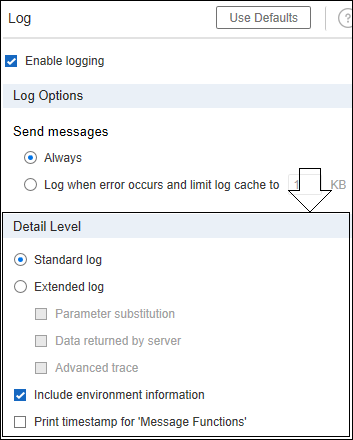
1. Standard Log: The standard log captures a subset of functions and messages sent during script execution in the log file.


2. Extended Log: Extended log sends detailed script execution messages to the output log. You can use the extended log while debugging the script. It captures the log at Parameter, Server Data and Advanced levels.

i. Parameter substitution: It captures the parameters and their values in the log file.

ii. Data returned by server: It captures the full server response which helps to identify the dynamic values in the script. ‘Data returned by server’ setting is very useful for correlation.

iii. Advance Trace: This option captures the log at a very deep level. It provides logs for all the Vuser messages and function calls etc.
Additional Options: You can enable ‘Include environment information’ to get the details of the environment and the ‘Print timestamp for Message Function’ option to capture the timing of the event.
What are the settings used for debugging, display output messages and correlation?
1. Display output message: Uncheck ‘Enable logging’.
2. Script Debugging: Check ‘Enable logging’ and select ‘Log when an error occurs’ along with the Standard log level. Additionally, you can also choose the log option as ‘Always’ along with Standard logs.
3. Correlation: Check ‘Enable logging’ and select ‘Always’ as the log option along with ‘Data Returned by server’ as the log level.
Note: You can check all three options in the extended log to get all the required log messages in one go.
You may be interested: