JMeter Debug PostProcessor is used to find the bug in the parent sampler. The output of debug post-processor can be viewed in the ‘View Result Tree’. Basically, Debug PostProcessor displayed 4 properties which are described below in the post.
How to add ‘Debug PostProcessor’?
You can follow the below steps:
- Select the ‘Sampler’ element where you want to add this post-processor
- Right-click on the sampler
- Hover the mouse on ‘Add’
- Hover the mouse on ‘Post Processors’
- Click ‘Debug PostProcessor’

What are the input fields of ‘Debug PostProcessor’?
‘Debug PostProcessor’ has the following input fields:
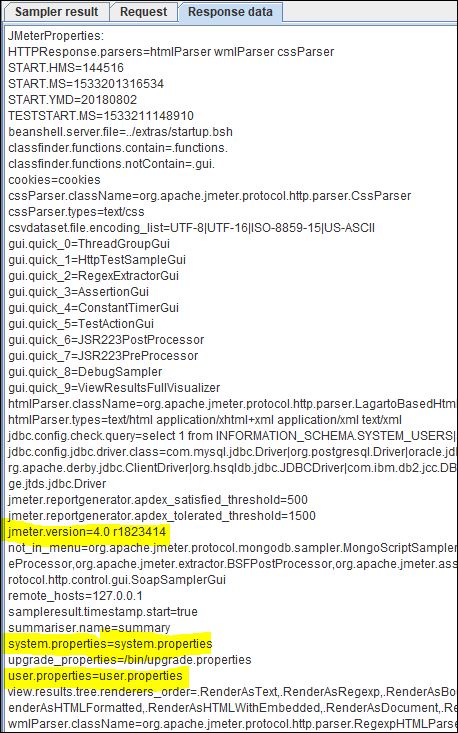
- JMeter properties: By enabling this option you can see the properties used by JMeter during the test execution. Some of the important properties are like user.properties, system.properties etc. If you suspect the issue in JMeter Properties then you can verify the value of each property passed during the test. Refer to the below screenshot to get a detailed list of JMeter properties which is shown by Debug postprocessor as an output. The default value of this attribute is False.
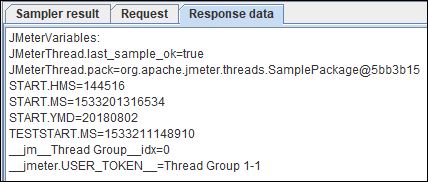
- JMeter variables: The default value of this attribute is False. This option is enabled to get JMeter variable values. Here you can verify the JMeter Thread, sampler start time etc.
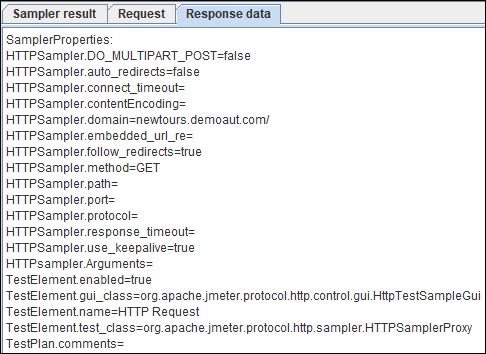
- Sampler properties: This attribute is used to show the main purpose of Debug PostProcessor. By default, the value of Sampler Properties is True and it displays all the properties of the parent sampler like Host, Port, Host attributes etc. Refer to the below screenshot to get the full list of Sampler Properties which is shown by Debug postprocessor as an output.
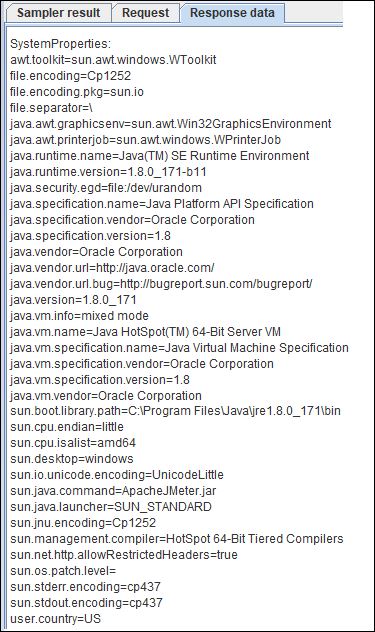
- System properties: By default, this attribute is False, because it contains lots of information about the system (machine on which test is executed) like OS name, OS version, java version, user details etc.
You may be interested:
- Performance Testing Tutorial
- Performance Engineering Tutorial
- Micro Focus LoadRunner Tutorial
- NeoLoad Tutorial