
Written By: Swetha Pujari
This post provides interview tips for performance test engineers to understand the way to answer or describe the concept of performance engineering and testing during the interview. Interesting answers to some of the template questions in tech interviews.
First Segment
Let’s start with the most expected question of all time.
Introduce yourself | Tell me about yourself.
Tell a story. Your story is unique and should demonstrate your professional journey. Make sure to include all key achievements and at the same time keep it interesting. Limit it to 2 minutes.
Main Statement < Over the course of XX years, I have built versatile skills in many tools and technologies and garnered a varied experience in delivering resilient products to customers >
Education <I have a Bachelor’s degree in Computer Science from University >
Career < I started my career with XXX Company and worked my way up from Intern to Senior QA Engineer. I moved to YYY Company/Onsite in order to challenge my capabilities and grow from a Team player to a Team Leader. During my time with the AAA project, I worked closely with development teams to understand the pain points and brought order to the non-functional testing process resulting in a 50% reduction of production bugs and more than 80% of human effort. I carried the same momentum with me to many other projects resulting in highly robust outcomes. I was doing exceptionally well here but I had to quit and move to ZZZ Company to take further responsibilities as a Delivery Manager. In my current role, I help projects in digital transformation and work with cross-functional teams to shift left the performance testing thereby ensuring delivery of quality products across all agile sprints >
Personal < I am a person who believes in getting things done smartly. I am positive that I can complement the teams I work with by bringing my unique flavour of navigating through different testing tools and technologies with ease.
My interests include writing, gardening, and hiking uneven terrains >
End <That is about it> And Smile!
Bonus Tip: Your hobbies exemplify your personality.
Talking about at least one interest that is productive in nature instead of hobbies that are merely consuming. Stating that you listen to songs in your free time makes you sound lethargic. However, mentioning that you play a certain musical instrument sets you apart from your competition.
Technical Knowledge:
Q. How to identify the factors for Slowness in a Web Application?
Two-way approach:
- DevTool: First, use DevTools such as Chrome Tools that come inbuilt with Chrome Browser.
- Network Tab:
- Run the application with Chrome tools on and verify the Page size, Network Resources and number of requests for the page to fully load. From here, verify if the different pages have Content-Encoding enabled (compression enabled or not)
- Console Tab
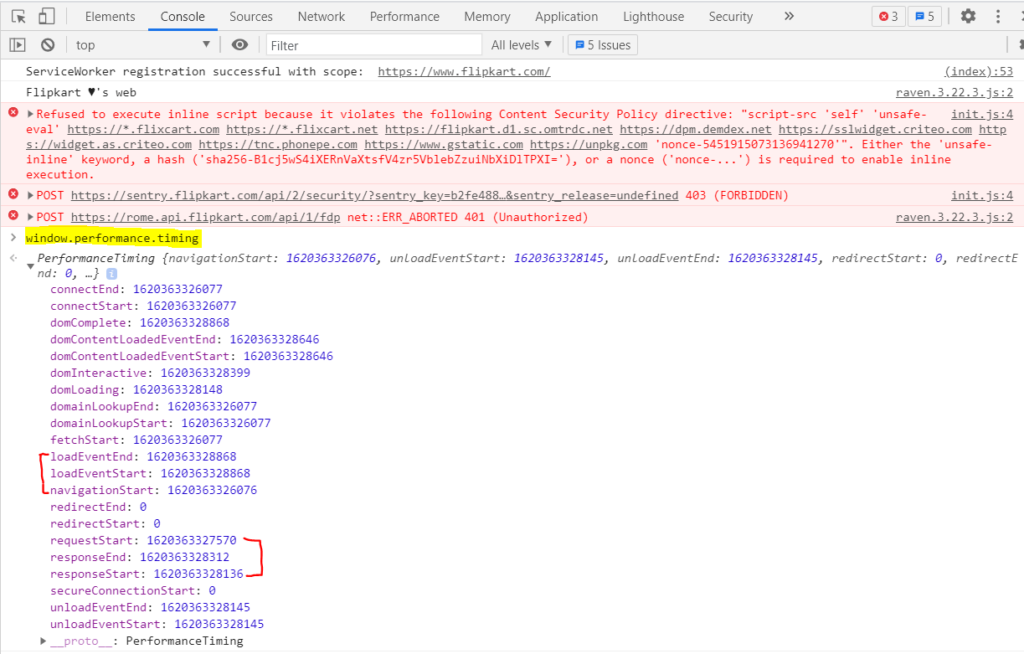
- Use the command ‘window.performance.timing’ to evaluate the different segments of the page load time. For example, ascertain the different load times
- Calculate the TTFB: Time to First Byte
Response start – request start = TTFB * last five digits of the timestamp
Refer to the below screenshot :
=> 28136 – 27570= 0.566 seconds (TTFB: 566 milliseconds) - Calculate the time taken from the navigation to the last event in the browser
Load event end – Navigation start = Load Time of Page * last five digits of the timestamp
Refer to the below screenshot:
=> 28868 – 26076 = 2.792 seconds (Page load time: 2792 milliseconds)
- Network Tab:
- Load Testing Tool
- Use any load testing tool such as LoadRunner or open-source JMeter
Q: Why is Performance testing beneficial to applications longevity?
- To experience how the systems respond to incoming traffic
- To optimize the system infrastructure
- To baseline and benchmark for future releases
- To make an informed go-live
Q: What are the common performance bottlenecks?
- High Response Times
- Slower TTI (Time to Interactive)
- CPU spikes
- Memory leak or ineffective memory utilization
- Expensive SQL queries
- Application Crashes
Q: Is the end-user experience in the Browser equal to the Testing Tools such as LoadRunner or JMeter response time metric?
No. Load Testing tools calculate the response time until the Time to First Byte received from Server (TTFB). End-user experience also includes client-side processing such as unzipping the resource files, Image/Text Compression/Decompression, Layout calculations, Page size, Resource download, cache retrievals, and processing images/dynamic content.
Q. What are the different types of Performance Testing?
- Stress Testing: To identify the breaking point of application
- Load Testing: Identify application’s ability under anticipated user load
- Endurance Testing: To ensure the application can handle the load over a long period of time
- Scalability Testing: Application’s effectiveness in scaling up to support an increase in user loads with the current infrastructure in place
- Volume Testing: Database is populated with large volumes of data and load tested to see the database performance
Q: Given an application for Performance testing, what is the process you follow?
There is more than one way to answer this. One common approach is to detail the Testing process from start to end, which is PTLC (Performance Testing Life Cycle).
- Requirement Gathering Phase: Meet the different external and internal stakeholders and gather information pertaining to the Application architecture, technical stack it was built on, critical business scenarios/use cases, the objective of the testing assignment, and the timelines.
- Test Plan and Design:
- Identify the testing tool and do a proof of concept to establish the compatibility between the application and the testing tool.
- Identify the different tests required to meet the objective of the testing
- Come up with a detailed entry and exit criteria of the testing approach and get the sign-off
- Test Development/Execution Phase
- Assessment Phase: Use ChromeDev Tools to validate the single user response time of the application against different functionalities. Use Auditing tools such as Lighthouse, webhint.io in order to get a performance score for the application in the test. Then work on the test scripts and model the test scenarios to align the different load conditions to different functionalities. Use Pacing and think times wisely. Perform the testing and analyse the client-side metrics such as Response times, Hits per second, throughput, and errors.
- Server Monitoring: Measure application performance in terms of system availability, CPU Utilization, and Memory management. Gauge user experience across Web and mobile devices.
- Tuning Phase: Work with development teams to report the bugs/anomalies identified in the test runs and provide detailed recommendations. Once the application is tuned, reiterate the test runs and quantify the improvement in percentage (%) to present the before and after testing footprint.
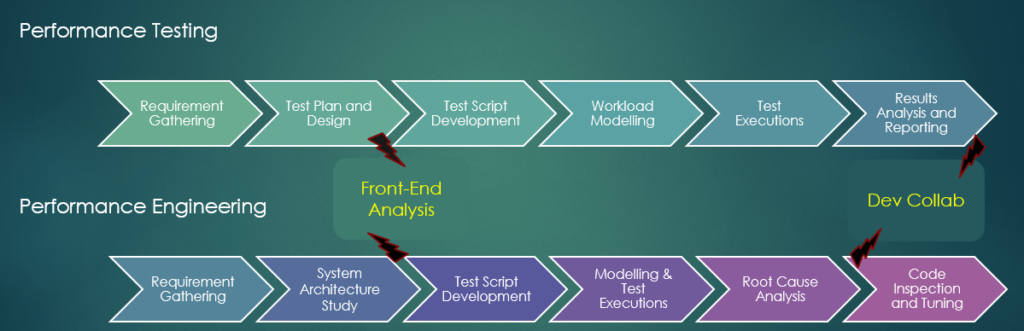
Q. What is the difference between roles of Performance testing and Performance Engineering?
Q: How do you diagnose a memory leak?
Concept:
The Worst way to find a mem leak is when the app crashes with an Out of Memory error.
- Inefficient programming usually leads to anywhere between 30-70% of memory wastage
- Memory Leak / Out of Memory errors / Allocation failures
- Memory Hogs –
- wrong DS choice
- Suboptimal data type usage(‘long’ instead of ‘int’)
- Redundant data
To analyse and understand the situation better, we need Heap logs/heap dump.
Ways to Download Heap Dump:
- Triggers automatically when Out of memory is encountered in the working directory of VM or specifying a path: XX:HeapDumpPath=path
Parameter for trigger: XX:+HeapDumpOnOutOfMemoryError
- Using jmap utility of JVM
jmap -dump:format=b,file=heap.bin <pid>
- Download manually with the help of the Dev team
After the retrieval of logs, utilize the tools like https://heaphero.io/ to analyse and identify the issues.
Sample Report: https://heaphero.io/heap-report2_0.jsp
Q: How do you identify the cause of sudden CPU spikes?
Concept:
Step 1: First Identify the process ID behind the high CPU %
- Login to the Linux server and Use top command
- Identify the PID of the process that has the highest CPU %

Step 2
- Map the processID to the ThreadID
Cmd: top –h pid - Results in a PID which is to be converted into hexadecimal value
Step 3
- Download the thread dumps using Jstack [Available in the latest JDK]
Jstack –l/f <pid> /opt/tmp/threadDump.txt
Step 4
- In the thread dump, look for the error logs against the ThreadID retrieved from Step 2(hexadecimal value)
- Send the error logs to the Developer team to get them fixed
Step 5 (Eliminate the Step 1 through 4 )
- Can also analyse the thread dumps using the below popular tools for detailed recommendations/suggestions and share the info with the Development team
Q: Garbage Collection
Objects are stored in Java Heap memory. GC or Garbage collection is supposed to clear the references to the unused or unreachable objects periodically. A memory leak is usually a case when the garbage collection is not able to do its job in cleaning up or creation of objects at such a high rate that GC is unable to sweep them effectively.
- GC Log Anatomy
- Format dependent on JVM and GC version
Type of GC: Full GC/Minor GC
Memory Segment : PSYoungGen/PSPermGen/PSOldGen
Execution time in second (3.4230220 secs)
Details of MemoryUtilized->MemoryAfterGC(TotalMemoryspaceallocatedforMemorySegment)

- Download GC Logs :
- -XX:+PrintGCDetails -XX:+PrintGCDateStamps -Xloggc:/opt/app/gc.log
- Use GC Log Analyzer(IBM)
- Log analyzer to get recommendations and suggestions on the possible issues
Q: What is Indexing?
When SQL queries are slower, it is often advised to index them.
What is an Index?
An index is a data structure that improves the speed of data retrieval operations on a database table. Indexes are also used to define a primary key or unique index which will guarantee that no other columns have the same values.
This means that once you have created an index, you can select or sort your rows faster than before.
The goal is to index the major searching and ordering columns.

Some tips to improve SQL queries
- Index the long-running queries
- Avoid loops that have a tendency to become recursive or run indefinitely. They often end up causing sudden CPU spikes
- Potential Cause of High Logical Reads in SQL statements
- Select statements without Where clauses
- Nested Select statements
- Both of the above lead to millions of data retrievals in a load test
- Generate AWR reports and compare before, during, and after test stats to analyse the patterns
Hiring Manager: Do you have any questions for us?
Q: Can you please run me through a typical day for a person in this role. I am keen to understand the responsibilities better. < Make this a discussion by asking more questions like do the People work in silos or in a more collaborative space, what kind of R&D is happening with respect to onboarding new industry tools, and what kind of projects does the team foresee in the future, any AI in scope? >
Q: What should a person in this role accomplish in the first three to six months?
Q: <Mid to senior positions> what is the most common reason for resignations in this company? [This helps in establishing the company’s low points in case you have multiple offers and you are weighing them]
Final Note: Thank the Interview Panel sincerely.
< It was a great discussion; I mainly enjoyed talking about this topic and would love to explore it further. Thank you for your generous time. I appreciate it >
Some random sites to keep abreast about current Performance trends:
- Podcasts: https://testguild.com/podcasts/performance/
- Resources: https://dzone.com/apm-tools-performance-monitoring-optimization
- Tutorials: https://www.youtube.com/user/QAInsights/featured
- Performance Testing Certifications: https://github.com/QAInsights/Performance-Testing-Certifications
- Software Testing Repository: https://www.javatpoint.com/
PS: I shared many links to websites in this article. I found these resources quite helpful in learning or unlearning some of the tough concepts and I am sharing them forward to benefit anyone who is here to learn. Please note that I am in no way advertising them or marketing them. I hope you will use them at your own discretion.
You may be interested:
- LoadRunner Interview Questions
- JMeter Interview Questions
- Performance Testing Interview Questions
- Performance Testing Quiz
nicely summarised the all questions and answers, this is very helpful
Well done Swetha !!
Thanks!