The generation of Thread Dump can be done through various methods, especially on Windows servers. Following are the steps to generate the thread dump on Unix, Linux and Windows machines.
On Unix Server:
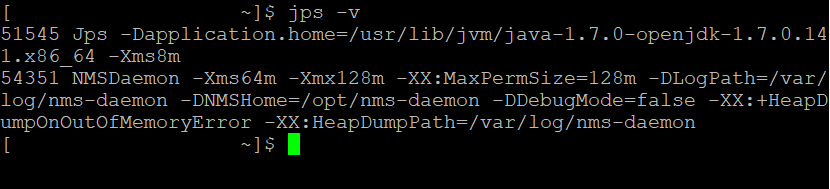
Step 1: Before generating the thread dump you must know the Java process ID running on the server. The Java processID (PID) can get using “jps” command in the Unix server. In the below screenshot, 54351 is a processID (PID) of the NMSDaemon java thread.

If you want to view the details of the process then run “jps -v” command.
Step 2: Once you get the PID (e.g. 54351), you can view the thread dump using “jstack <PID>” command.

If you want to extract the thread dump in a file then use “jstack -l <PID> > <file path and name>“


Note: The ‘jstack’ tool is included in JDK since Java 5. If you are running in an older version of Java, then run “kill -3 <PID>” command. When this command is used thread dump is sent to the standard error stream. If you are running the application in Tomcat, the thread dump will be sent into <TOMCAT_HOME>/logs/catalina.out file.
On Linux Server:
Step 1: Use “ps -ef | grep java” to get the java process ID.
Step 2: Use “kill -SIGQUIT” command along with PID.
On Windows Server:
Step 1: Download javadump.exe
Step 2: Start the JVM with these three arguments (they must be in the right order):
-XX:+UnlockDiagnosticVMOptions -XX:+LogVMOutput -XX:LogFile=C:\temp\jvmoutput.log
Step 3. Press Ctrl+Shift+Esc to open the Task Manager
Step 4. Get the PID of the Java process (under the “Details” tab)
Step 5. From the command line, run “javadump.exe <pid>” command
Step 6. The thread dump will appear in the jvmoutput.log file mentioned in step 2.
Another method to generate and analyse the thread dump on the Windows server is:
Step 1: Go to the bin folder of JDK (e.g. C:\Program Files\Java\jdk1.8.0_131\bin)
Step 2: Launch JVisualVM by clicking “jvisualvm.exe”

Step 3: Java VisualVM tool will be launched
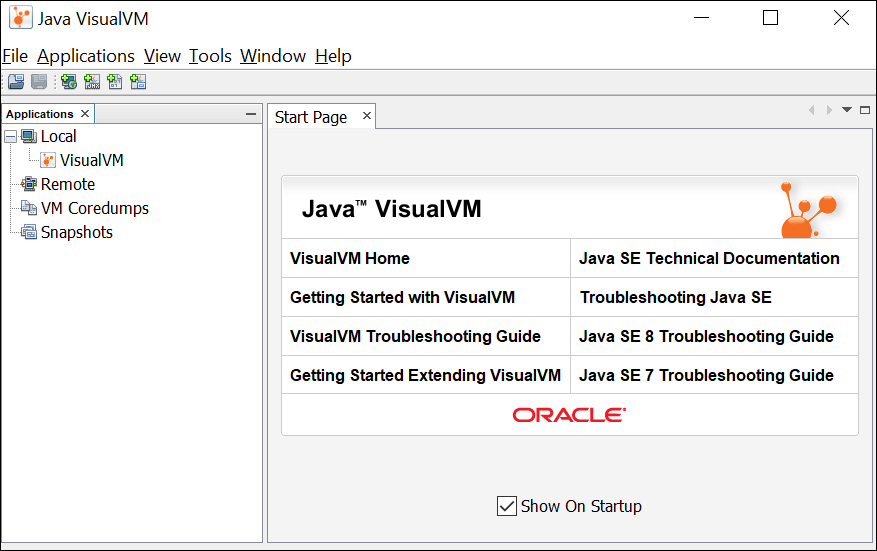
Step 4: Right-click on the Java process appears under ‘Local’

Step 5: Click “Thread Dump”. The thread dump will be generated and opened in the right pane for analysis.

You may be interested: