
Written By: Md Sayful Alam Murshed
JMeter Real-Time Debugging (All In One) article briefs you about setting breakpoints in JMeter and running the scripts in debug mode like an IDE, using BlazeMeter step-by-step-debugger.
Debugging is a very common task for JMeter during developing the JMX scripts like fetch dynamic values, creating a correlation among the requests, validate responses, drive the data from an external source, set up authentication etc. To debug the JMX scripts, we normally use Debug Sampler, Dummy Sampler, Debug PostProcessor, Log Functions, Log4j and enable debug for a particular element. Practically, debugging a complex script manually is a tricky process!
So, if you want to perform high-level debugging, JMeter has a very useful external debugging plugin called ‘BlazeMeter step-by-step debugger‘. BlazeMeter step-by-step debugger makes the debugging process very simple. Even you can use it at runtime where you can set ‘breakpoints’ and perform actions such as ‘Step Over’, ‘Continue’ or ‘Pause’ execution just like other regular IDE!
How to install BlazeMeter Step-By-Step debugger?
To install this plugin, you can follow the below steps:
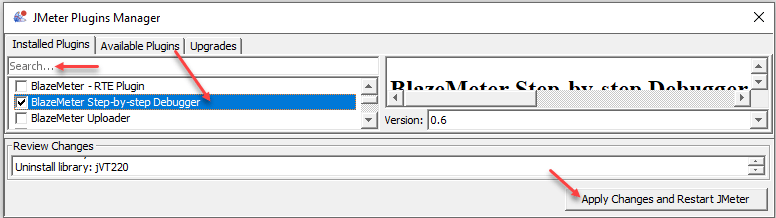
- Launch the ‘JMeter Plugins Manager’ tool from the JMeter option menu.
- Click on ‘Available Plugins’ and search for ‘BlazeMeter Step-by-step Debugger’
- Check mark the option ‘BlazeMeter Step-by-step Debugger’ and click on the ‘Apply Changes and Restart JMeter’ button.
- Once the JMeter will restart, then you should see the following option/icon in JMeter.

How does it work?
First, you should keep in mind that ‘BlazeMeter Step-by-step-debugger’ does not support multiple Thread Groups at a time. If you have multiple Thread Groups then you can debug them one by one. Also, it does not support ‘Module Controller’ and ‘Include Controller’.
This debugger tool follows the ‘Execution Hierarchy’ of JMeter elements for debugging purposes and the order of execution is:
1st – Config Elements
2nd – Pre Processors
3rd – Timers
4th – Sampler
5th – Post Processors
6th – Assertions
7th – Listeners
How to start script debugging?
Step 01 – Launch the ‘Step-by-step Debugger’ Tool.
Select the Test Plan and click on the ‘Debugger’ button (you can launch this from ‘Run’ options as well as). Then, it will launch the debugger tool along with all the active Thread Groups into your Test Plan.
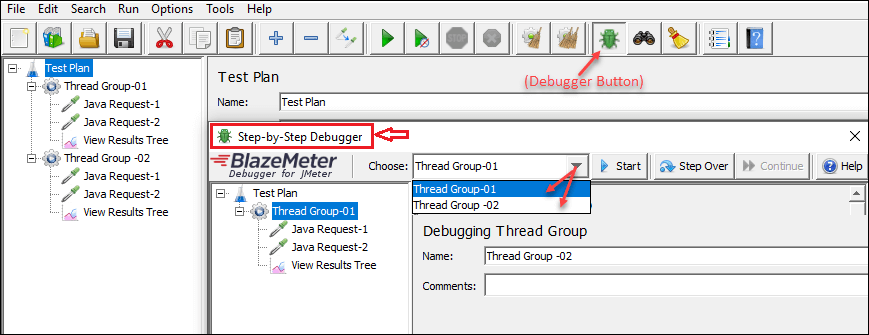
Exception: If you have multiple ‘Thread Groups’ in your Test Plan, ensure that each ‘Thread Group’ must have a unique name, either debugging tool will recognize that they are duplicates. And in this case, it will only fetch the elements from 1st matching Thread Group.
Step 02 – Choose the target ‘Thread Group’ from the Drop-Down
If you have multiple ‘Thread Groups’ in your Test Plan then select the ‘Thread Group’ from the choose option (drop-down) that you want to debug.
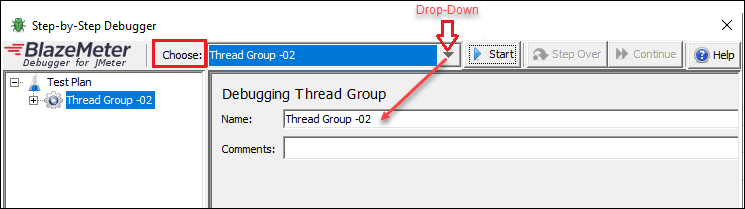
Only the chosen Thread Group will be appearing in the Test Plan.
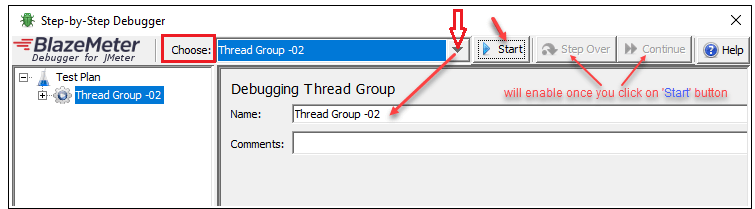
Step 03 – Start Debugging by ‘Step Over’
Before starting debugging the below things you should keep in mind:
- If any of the elements is disabled under the selected ‘Thread Group’ then they will be excluded.
- The debugger continually focuses on the next element to be executed.
Now, to start debugging you need to press the ‘Start’ button (‘Step Over’ and ‘Continue’ buttons will be enabled after clicking on ‘Start’)
Let’s say you are extracting the values from the Response Body via JSON Extractor in your script. To fetch the value, you have already added JSON Extractor and defined the required fields which are ‘Names of created variables’, ‘JSON Path expressions’, ‘Match No’ and ‘Default Values’. Now, you want to validate the JSON Extractor via ‘BlazeMeter Step-by-Step Debugger’ whether it is working correctly or not. So,
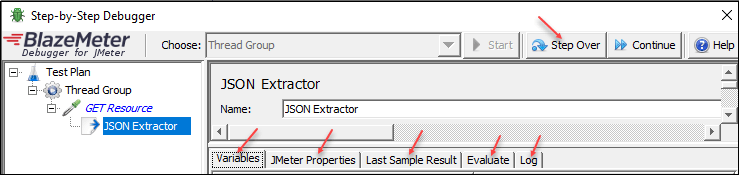
- Click on ‘Step Over’ button to execute the request. The request has been executed.
- Again, click on ‘Step Over’ button to view the information about JSON Extractor under the ‘Variables’ tab.
- Along with the ‘Variables’ tab, there are some more tabs which are:
- JMeter Properties
- Last Sample Result
- Evaluate
- Log
Explanation of each tab:
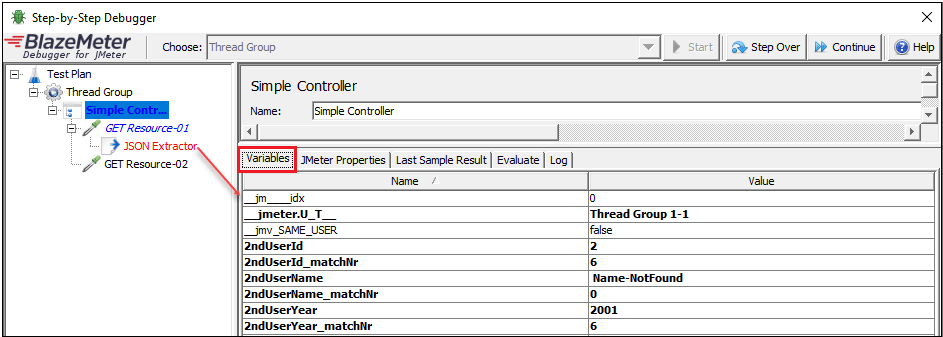
Variables: This tab is used to view the used variables’ names and their respective values. When you click on the ‘Variables’ Tab then you will see the details of the variables as shown in the below picture. Here, you can validate the expected value that you are trying to extract from the response body. In the below screenshot, we are trying to extract only the 2nd UserId, UserName and UserYear from the ArrayList of the Response Body.
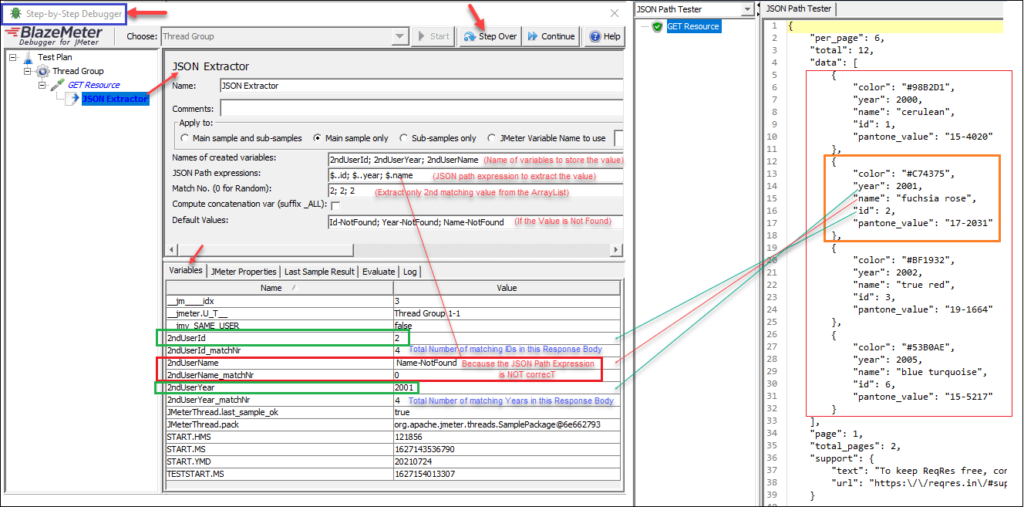
In this above JSON Extractor, we defined three variables (2ndUserId; 2ndUserYear; 2ndUserName) along with corresponding JSON Path Expression ($..id; $..year; $.name) respectively. As per the outcome of the debugger, we can see the values of defined variables. Since the JSON path ($.name) was not correct so the extractor did not get the matching value and returned the default value ‘Name-NotFound’. Now, you can correct the wrongly defined JSON Path Expression and resolve the identified issue.
Similarly, you can validate the correctness of the other extracted values like 2ndUserId=2, 2ndUserYear=2001 and user-defined variables (if you have one).
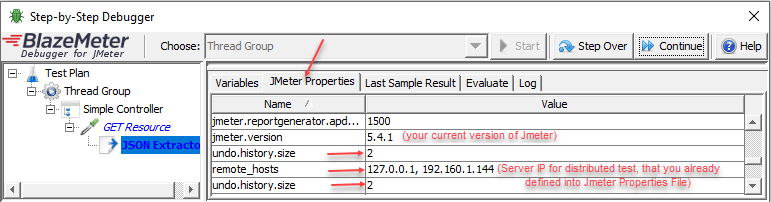
JMeter Properties: If you already defined/customized any additional JMeter properties for your test like Remote hosts configuration, Retries Delay, Retry Count, Undo History Size etc. and you want to make sure that the configuration is succeeded or not then you can directly validate that information in the ‘JMeter Properties’ tab of the debugger. Refer to the below screenshot:
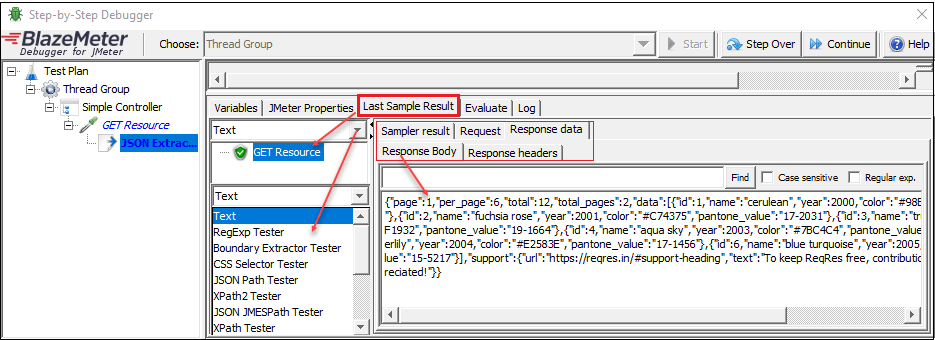
Last Sample Result: This is the same as the ‘View Results Tree’ where you can view Sampler Result, Request Data, Response Data, Response Body, Response Headers etc. Another benefit of the ‘Last Sample Result’ tab is you can also use it as RegExp Tester, JSON Path Tester, XPath Tester etc. It has similar options as ‘View Results Tree’ has, so you don’t need to add ‘View Results Tree’ separately. Refer to the below screenshot:
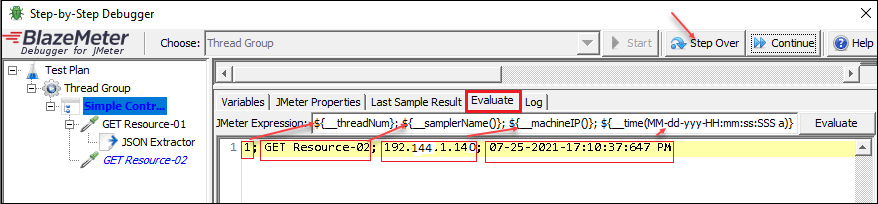
Evaluate: This feature is used to validate and monitor the information like what thread is just executed, which request is just executed, what is the machine IP, TimeStamp, the value of the variables etc. You can pass any of the JMeter Functions related to the particular elements in the ‘Evaluate’ tab.
So before clicking on the ‘Step Over’ or ‘Continue’ option (the continue option can be used if you set ‘breakpoint’), go to the ‘Evaluate’ Tab and supply your desired JMeter Function into the JMeter Expression field. After that click on ‘Step Over’ repeatedly, each time the debugger tool re-evaluates the value for you. If you would like to review the value again, simply click the ‘Evaluate’ button on the JMeter Expression line.
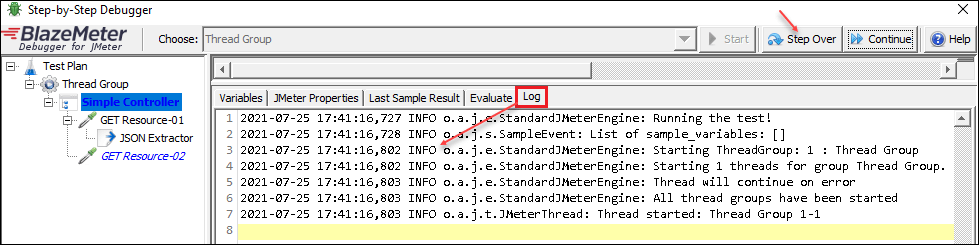
Log: This log option is as same as the regular JMeter Log Viewer Panel where you can view the execution events and it contains lots of useful information which are ERROR, WARN, INFO, DEBUG etc. This descriptive information helps you to debug the scripts functionally.
How to set a Breakpoint and Start Debugging?
Before you set a ‘breakpoint’, you just need to launch ‘Debugger Tool’. You can set a single or multiple ‘breakpoints’ at the same time for an element. To set a breakpoint and start debugging, you can follow the below steps:
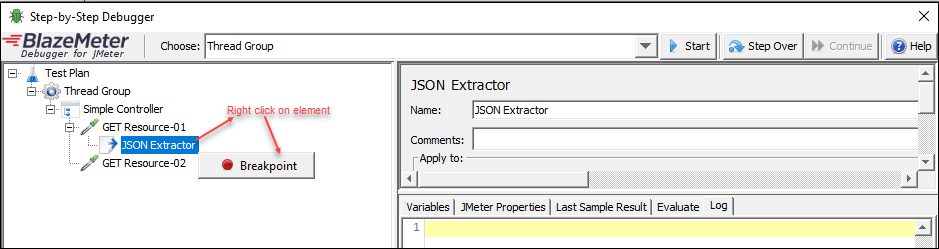
- To set a ‘Breakpoint’, launch the debugger tool and select the target element(s) and right-click on it. Once you right-click on an element ‘Breakpoint’ button will appear then click on the ‘Breakpoint’ button.
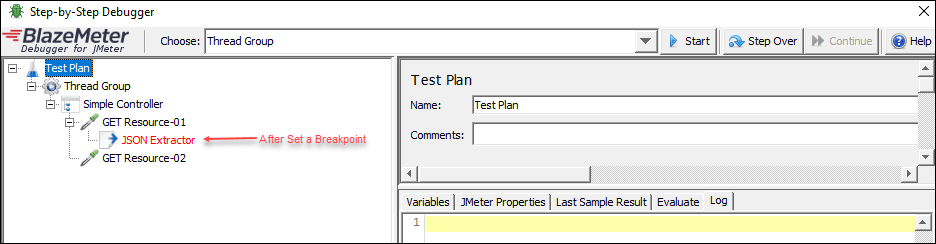
- Once you set a ‘breakpoint’, that element will turn into red colour. Refer to the below screenshot:
- Then click on the ‘Start’ -> ‘Continue’ button
- In this scenario, we set a ‘breakpoint’ for the JSON Extractor, so the thread should pause at that point. Refer to the below screenshot in which you can see JSON Extractor is highlighted and the thread is paused.
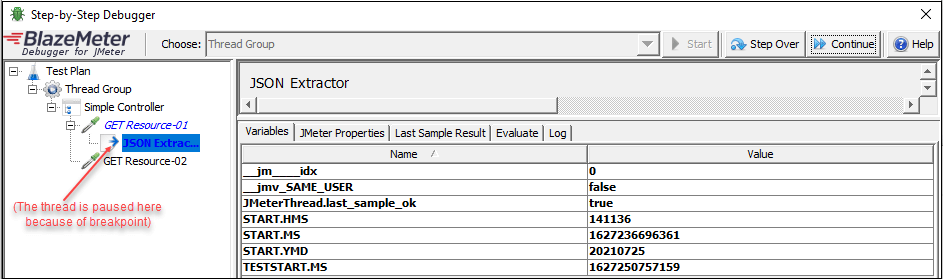
- Click on the ‘Step Over’ to execute the request where the thread was paused due to a ‘breakpoint’. So as long as you clicked on the ‘Step Over’ button, the thread will be executed and you will see all the variables’ name/values that you want to evaluate.
Refer to the above screenshot, where you can see the value of 2nd UserId, UserName, UserYear and matchNr/(total matching number). But the variable named ‘2ndUserName’ has a ‘Name-NotFound’ value. It means something went wrong in the script and you have to troubleshoot and figure out the issue.
You can set a ‘breakpoint’ for the Sampler, Controller, Pre/Post Processors, Assertions, Timer and Listener. But the ‘breakpoint’ is not applicable for Config Elements like HTTP Header Manager, HTTP Cookie Manager, HTTP Cache Manager, HTTP Authorization Manager, CSV Data Set Config etc.
You may be interested: