Skip to content

Blog

Response Time Graph

Response Time Graph

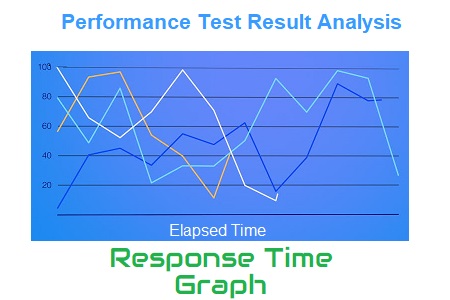
Response time graph gives a clear picture of overall time including requesting a page, processing the data and getting the response back to the client. As per PTLC (Performance Test Life Cycle), the Response time… Response Time Graph

Running Vuser Graph

User Graph

A User Graph provides complete information about the load patterns during the test. This graph helps to identify: In the runtime viewer, User Graph provides information about the number of users currently accessing the application. When… User Graph

Performance Test Result Analysis - Client Side Result

Client-Side Result Analysis

Client-side performance test statistics represent the behaviour of the application which an end-user may experience in the real world. The analysis of such stats and graphs is termed Client-side Result Analysis. As an outcome of… Client-Side Result Analysis