Skip to content

Network-side Result Analysis

Network-side performance result analysis is a follow-up to Client and Server performance analysis and tuning efforts that I have discussed in the previous articles (Performance Test Result Analysis Basic Level and Performance TestResult Analysis Intermediate Level). Once… Network-side Result Analysis

Error Graph

Error Graph

This is one of the basic graphs and frequently use to debug the performance bottleneck. The error graph provides details about the type of errors and the time when they occurred. Error graphs could be… Error Graph

Throughput Graph

Throughput Graph

This has been noticed that the throughput graph is always less attentive. The reason could be that a performance tester does not understand its importance or does not care about it because it is not… Throughput Graph

Response Time Graph

Response Time Graph

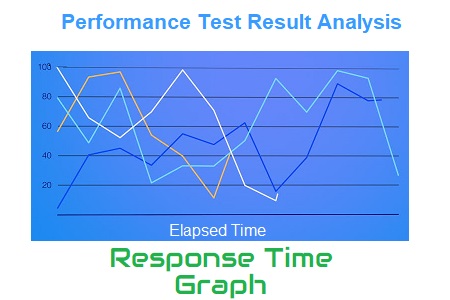
Response time graph gives a clear picture of overall time including requesting a page, processing the data and getting the response back to the client. As per PTLC (Performance Test Life Cycle), the Response time… Response Time Graph

Running Vuser Graph

User Graph

A User Graph provides complete information about the load patterns during the test. This graph helps to identify: In the runtime viewer, User Graph provides information about the number of users currently accessing the application. When… User Graph