
Pattern Method
This is a method of understanding the pattern of the graphs by analysing and comparing them and then concluding the result. This method consists of two parts: The best example to understand the Pattern Method… Pattern Method
This is a method of understanding the pattern of the graphs by analysing and comparing them and then concluding the result. This method consists of two parts: The best example to understand the Pattern Method… Pattern Method
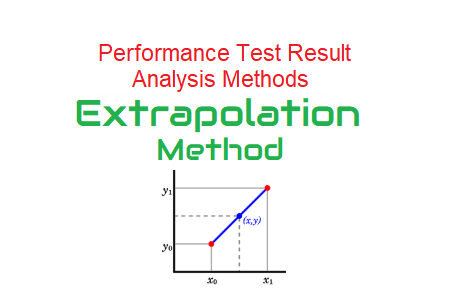
As per definition, Extrapolate refers to extending the application of (a method or conclusion) to an unknown situation by assuming that existing trends will continue or similar methods will be applicable. In Performance Testing, Extrapolation… Extrapolation Method

Eliminate method leads to filtering out certain requests, transactions or components from the list of culprits which cause performance issues. In the previous post, you read about the Drill Down method where we got an… Eliminate Method
Drill down method is used to concentrate on one bottleneck at a time and narrow down the focus to a component by drilling down till you get the exact root cause. It is pretty much… Drill Down Method

You would have used the correlation for dynamic values while preparing scripts in Micro Focus LoadRunner. Have you ever heard about graph correlation? If your answer is No then refer to Graph Correlation post first. Because… Correlate Method
