What is the ‘Hits per second’ graph in LoadRunner?
‘Hits per second’ refers to the number of HTTP requests sent by the user(s) to the Web server in a second. In terms of performance testing, there is a major difference in Transactions per second and Hits per second. A single transaction can create multiple hits on the server. A transaction is nothing but a group of requests in web test terminology. A LoadRunner script of a web-based application has some transactions and these transactions encapsulate requests into a group, e.g., a login operation which involves 5 HTTP requests can be grouped into a single transaction, so when you read a ‘Transactions per second’ graph and there is only 1 dot appeared then you can see 5 dots in the ‘Hits per second’ graph.
Many testers consider the definition of ‘Throughput’ as ‘the number of requests per second’ and hence they refer to throughput as the total number of hits in a test. As per LoadRunner, ‘Throughput’ is the amount of data from the server to the client, and ‘Hits’ or ‘Requests’ is the number of HTTP calls made by the client on the server. I follow the latter definition.
Purpose:
The main purpose of the Hits per second graph during the test is to keep an eye on the number of requests sent by LG (virtual user) to the server. After the test, you can compare the rate of hits with the throughput and investigate if any mismatch. Ideally, the throughput graph should follow the hits per second graph. If this is not the case or it follows a reverse (or flat) trend, then there could be a bottleneck that needs to be resolved.
Graph Axes Representation:
- X-axis: This graph has elapsed time on the X-axis. The elapsed time may be relative time or actual time as per the graph’s setting. This also shows the complete duration of your test (without filter)
- Y-axis: Number of requests (hits)
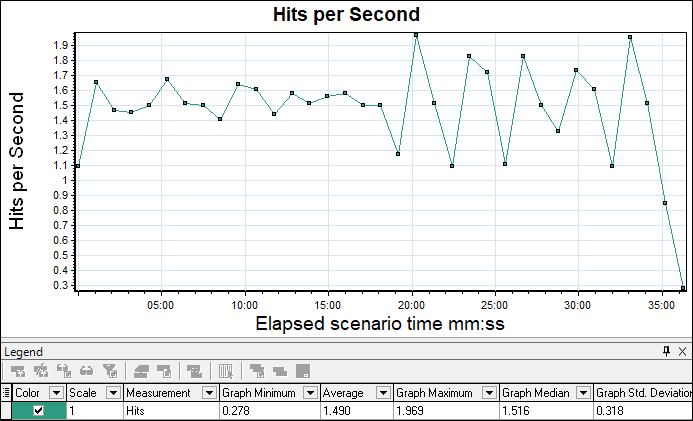
How to read the ‘Hits per second’ graph:
This graph is very helpful during the live test. The graph line shows how many HTTP requests are being sent to the server in the per-second interval. Once users are in a steady state, the hits per second graph should have a range-bound fluctuation, meaning there should be less deviation. If you see a drop in the hits per second rate, then you need to check the number of running users and the response time graph to understand the reason for the drop.
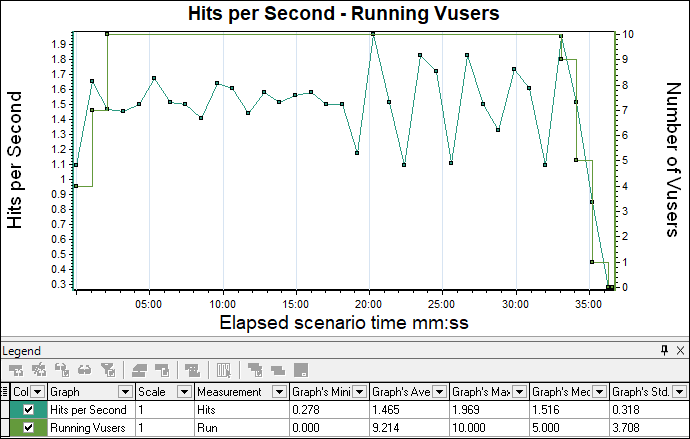
Merging of ‘Hits per second’ graph with other graphs:
- With Running Vusers graph: You can merge the hits per second graph with the Running Vuser graph to understand if any downfall in hits is due to the stop/exit of the Vuser.
- With Average Transaction Response Time Graph: The average transaction response time graph can be correlated with the hits per second graph to see how the number of hits affects transaction performance. An increase in response time impacts hits per second inversely. Due to high response time (with constant pacing and think time setting), you will get the decline in the hits per second graph.
- With Throughput Graph: As mentioned above, if Hits are requests, then the throughput is the response. Ideally, the hits per second graph should be followed by the throughput graph. If this is not the case, then you need to check the error or network latency graph.
