
AWR Report
In the heap dump and thread dump analysis topics, we have seen how the snapshot of memory and thread at a particular time describes the whole picture and helps to determine the performance bottleneck. In a similar fashion, the… AWR Report
In the heap dump and thread dump analysis topics, we have seen how the snapshot of memory and thread at a particular time describes the whole picture and helps to determine the performance bottleneck. In a similar fashion, the… AWR Report

In the previous post, you have seen how to generate Thread Dump on different operating systems. After generating the Thread dump, the next question comes which is “How to read Thread Dump?”. Thread dump provides… How to read Thread Dump?
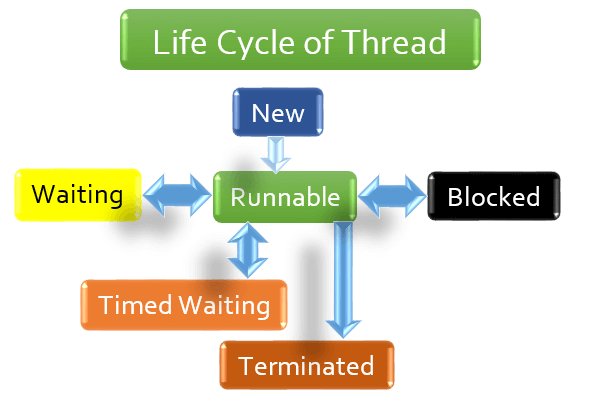
To analyse the Thread Dump it is necessary to know about the different states of the thread. These states are also called as “life cycle of the thread”. There are total 6 major states of… Life Cycle of Thread

Dumping is a well-known term in performance testing, whether it is heap dump or thread dump both are very useful to carry out the root cause analysis. We have already discussed Heap Dump and its analysis in… Thread Dump – Overview
Refer to the above figure (Figure 01). You can see two snaps of the same room. Would you be able to find the difference between them? I assume your answer will be ‘Yes’. Because you… Heap Dump – Overview
Introduction: fastThread is a fine thread dump analyzer, having all the basic features required to analyse a simple as well as a complex thread dump. It is an online open-source tool and can be accessed… fastThread – Thread Dump Analyzer